Viewing my Groovy source files in Stackdriver's debug view
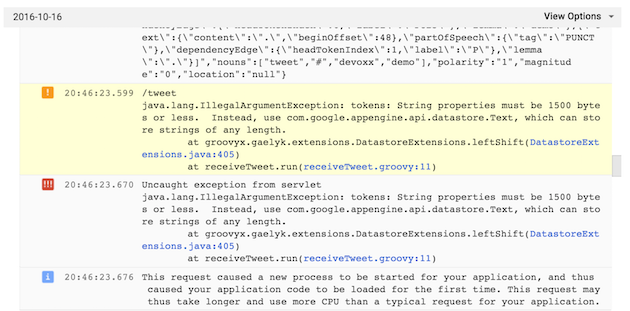
As I was working on a demo for one of my talks at Devoxx, I was encountering a bug in my Groovy code (a Gaelyk app using Glide). I had deployed a new version of my App Engine app, changing some code to persist some data in the Datastore. After those changes, I saw a trace in the logs:
Looks like there’s an error in receiveTweet.groovy on line 11. And there’s a link! Although I hadn’t linked the source code to the application, I was surprised to see this link. But I knew that Stackdriver is able to pick up sources in different ways (from uploaded local files, from a Google code source repository, from Github or BitBucket, or with a “source capture”).
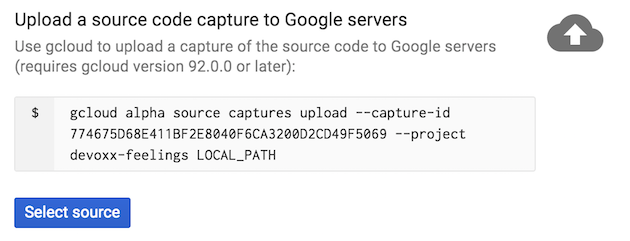
And actually, clicking that link brought me to the debug view, offering me the different ways to link to or upload the source code. Conveniently, the source capture approach provided a command, using the gcloud CLI, to link the sources with traces:
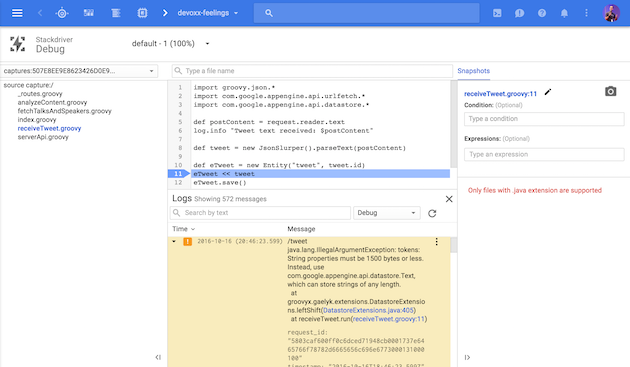
I then launched that command in my terminal, and I was able to see the trace along with my source code afterwards in the Web console:
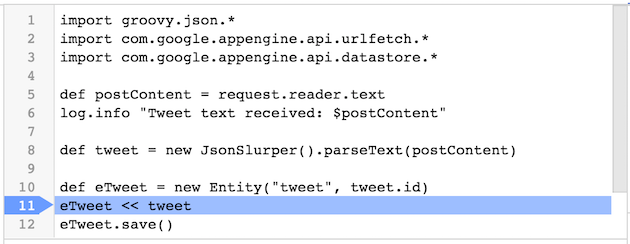
On the left side, I can see my Groovy source files, highlighting the offending script with the bug. In the middle column: at the bottom, the stacktrace, and at the top, the source code, with the line where the exception occurred highlighted in blue.
On the right, there’s also the live debugger view! But I haven’t played with it yet, but it’s pretty powerful, as you can live debug a production app! Let’s keep it for another post!
However, now with your Groovy hat on, you’ll notice two things:
The Groovy source code is not nicely colored! Syntax coloring is available for languages like Java, Go, Python, JavaScript, but alas, not (yet?) for Groovy!
The other funny thing was the red message on the right as well:
Although it says only files with .java extension are supported, it was nice to see that it was still showing my Groovy source code!
Summary
It’s pretty neat to be able to associate the code and the logs directly in the web interface, to quickly spot where problems are coming from. Of course, you can go back to your IDE or text editor to find out (and ultimately that’s what you’ll be doing) but it’s pretty handy to quickly visualize the origin of the problem and start figuring out what the problem may be.
Also, as I said, I haven’t tried the live production debugger, but it’s quite a killer feature in my book to be able to introspect a running app. It’s not always easy to figure out some problems locally, as your emulator is not the actually running infrastructure, your tests are mocking things out but are “not like the real thing”, so having the ability to dive deeper in the running system is pretty compelling!


