Visualize and Inspect Workflows Executions
When using a service like Google Cloud Workflows, in particular as your workflows get bigger, it can be difficult to understand what’s going on under the hood. With multiple branches, step jumps, iterations, and also parallel branches and iterations, if your workflow fails during an execution, until now, you had to check the execution status, or go deep through the logs to find more details about the failed step.
I have good news for you! Workflows recently added some deeper introspection capability: you can now view the history of execution steps. From the Google Cloud console, you can see the lists of steps, and see the logical flow between them. The usual workflow visualisation will also highlight in green the successful steps, and in red the failed one. Of course, it is also possible to make a curl call to get the JSON of the list of executed steps.
Let’s have a look!
In the console, when you click on an execution, in the summary tab,
you’ll see not only the failed step, but also the nice workflow graph colored green and red:
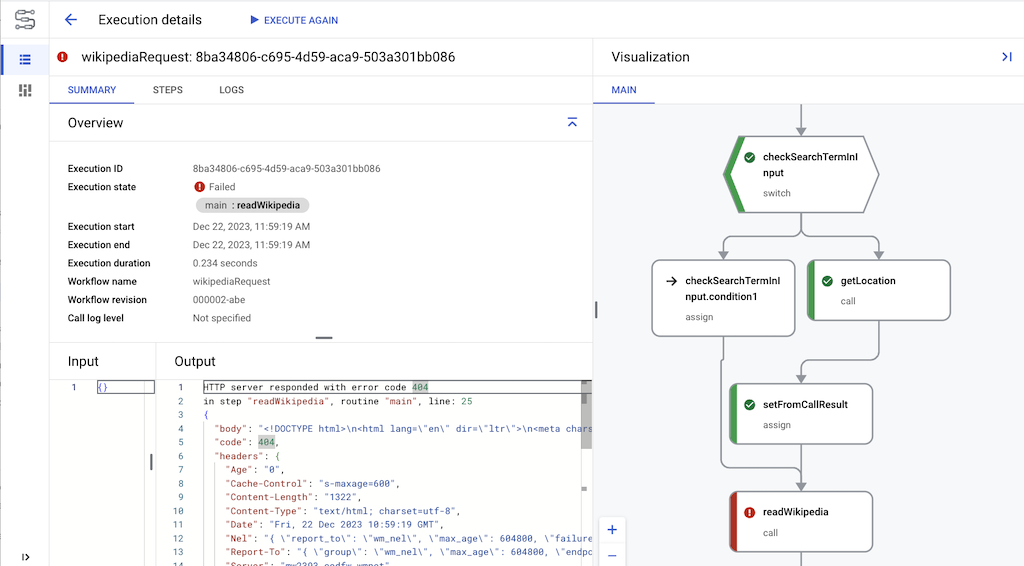
That way, you know which path the execution followed, in a visual manner.
But you can also see the actual list of steps executed, with more details, by clicking on the steps tab:
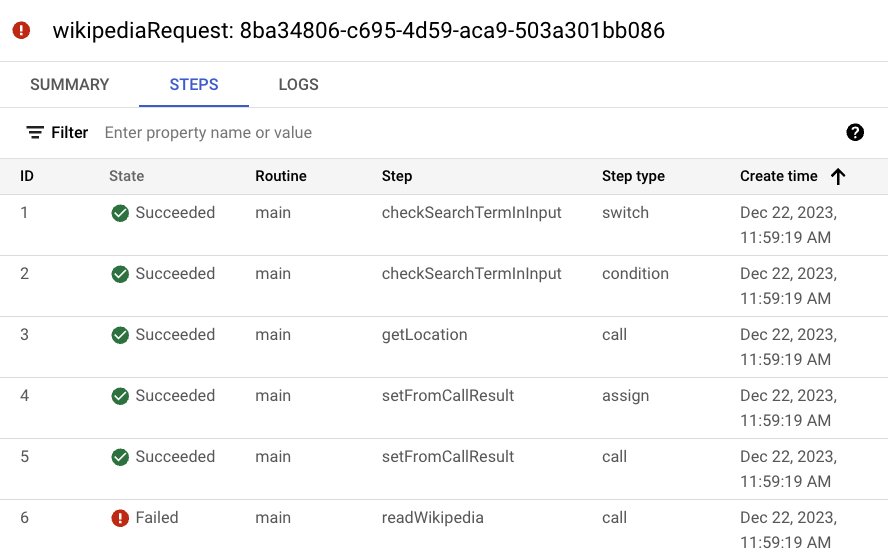
From this table, the filter will let you further refine particular type of steps you’d like to investigate, or visualise the steps of a subworkflow only, etc.
This is a nice improvement to the developer experience, and for your ops team, to better understand what happens during your workflow executions! Feel free to read more about this new capabability in the documentation about viewing the history of execution steps.