Visualizing ADK multiagent systems
Let me share an interesting experiment I worked on to visualize your AI agent structure, more specifically, Agent Development Kit (ADK) multiagents.
The more complex your agents become, as you split tasks and spin off more specialized and focused sub-agents, the harder it is to see what your system is really made of, and how the interactions happen between the various components.
This is also something I experienced when I was covering Google Cloud Workflows: the more steps in the workflow, the more loops I had, indirections, conditions, etc, the trickier it was to understand and debug. And sometimes, as the saying goes, a picture is worth a thousand words. So when I was working on my recent series of articles on ADK agentic workflows (drawing diagrams by hand) this idea of experimenting with an ADK agent visualizer came up immediately.
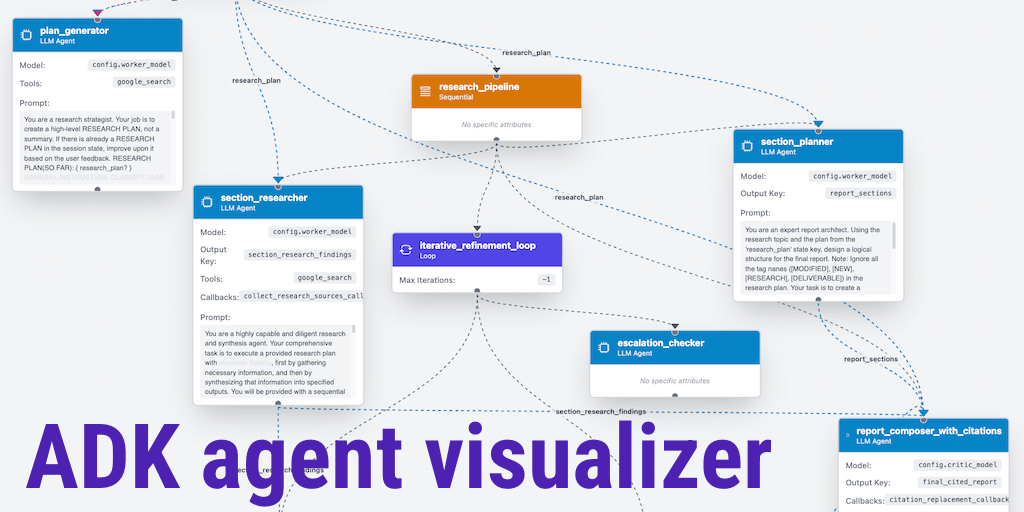
Let me introduce you to my ADK Agent Code Visualizer, a tool designed to give you a clear, visual representation of your agent-based applications built with the Agent Development Kit (ADK).
This is an experiment, not really something I intend to develop that much further. It works fine for single-file systems that you can easily copy’n paste in the visualizer. But it won’t understand your current project structure, and your agents spanning multipe files.
➡️ That said, for those who want to play with it already without further ado, please head over to this online version of my ADK code visualizer.
📂 I’ve also pushed the code of this project to GitHub if you want to take a look or further extend it.
From vibe-coding to cloud deployment
The journey of this project is a testament to the power of modern AI-assisted development. It all started in Google AI Studio, where I “vibe-coded” the initial concept. I provided a high-level description of what I wanted to build, and AI Studio generated the foundational React and Node.js code. From there, I moved to my local environment and used Gemini CLI for the iterative development process—adding features, refining the logic, and fixing bugs. The entire development experience was a seamless collaboration between human and AI. Yeah!
Finally, the application was deployed on Google Cloud, more specifically containerized on Cloud Run making it accessible for everyone to use.
What it does
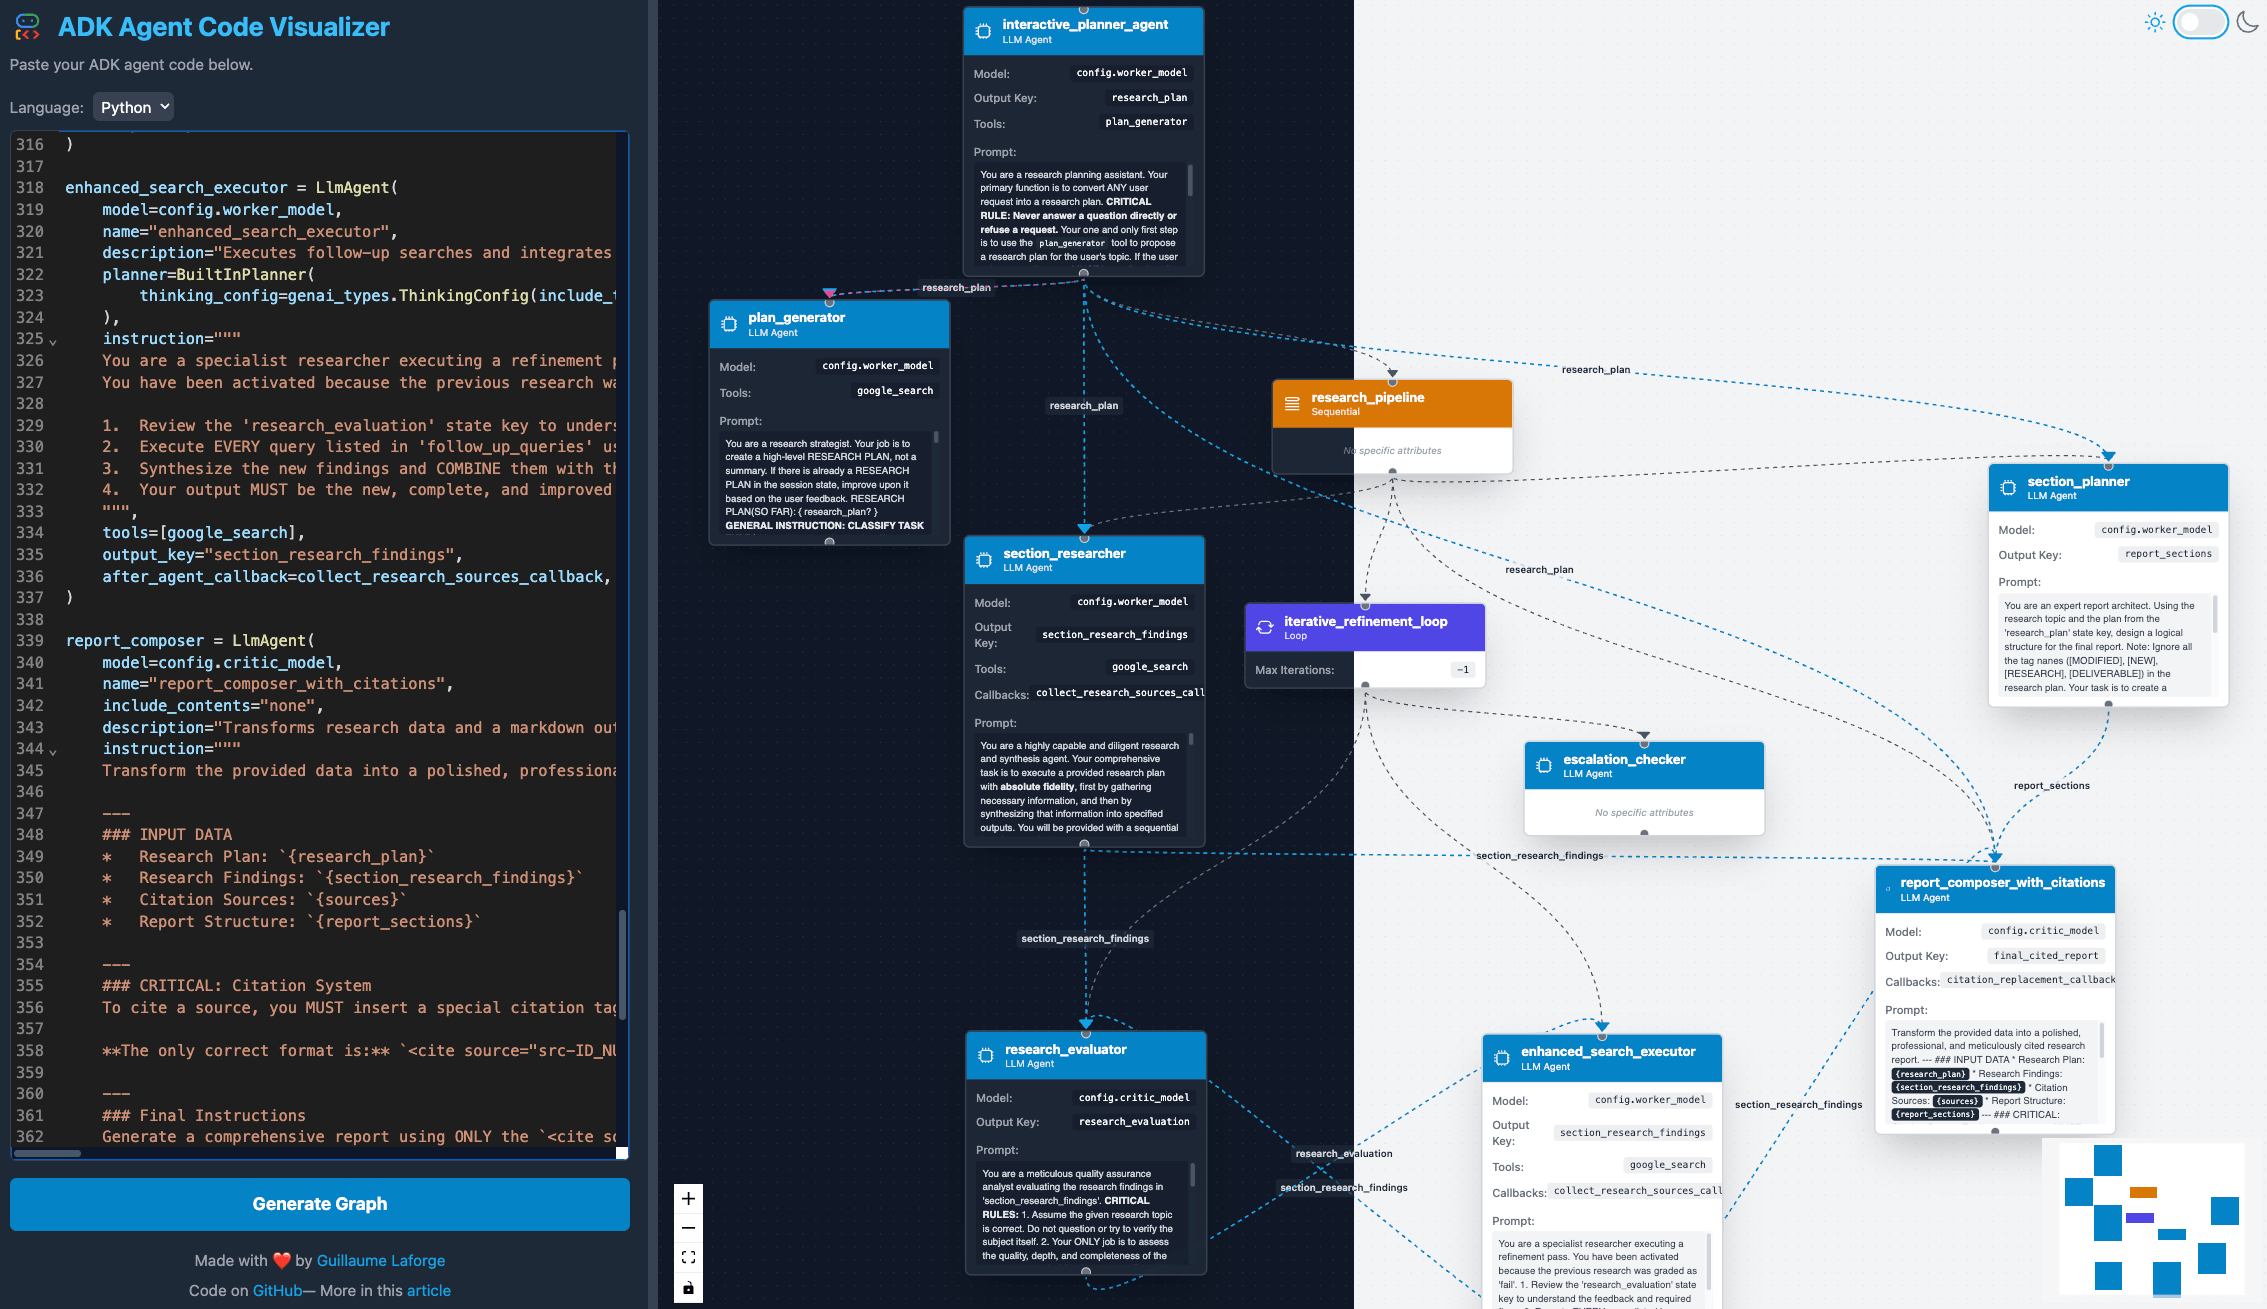
The ADK Agent Code Visualizer takes a single source file (Python or Java) containing an ADK agent definition and generates an interactive graph (using ReactFlow). This visualization helps you understand the architecture of your multi-agent system at a glance.
Here’s what the visualization highlights:
- Agent relationships: See how your agents are connected. Sub-agents are clearly marked with arrows indicating the flow of control.
- Tool usage: If an agent uses one or more tools, it’s indicated on the graph, giving you insight into the agent’s capabilities.
- Callbacks: The visualization also flags when callbacks are defined for an agent.
- Orchestration patterns: The graph shows whether agents are configured to run:
- Sequentially: One after another.
- In parallel: Executing concurrently.
- In a loop: Repeating a series of actions.
The visualization is composed of four main types of nodes (with different color codes), each representing a different kind of agent:
LlmAgent: A plain agent node.SequentialAgent: For agents that execute in a sequence.ParallelAgent: For agents that run concurrently.LoopAgent: For agents that repeat actions in a loop.
Whenever there are sub-agents or linked agents, you’ll see arrows pointing from the parent or preceding agent to the next one in the flow, making the orchestration logic easy to follow.
Dark mode!
And for all the nerds who prefer dark mode, you can easily switch between light and dark modes!
Limitations
As I said in introduction, it’s important to note a key limitation of the current version: the tool analyzes single source files only. This is more of a proof-of-concept than a finalized product. This means it does not parse an entire multi-file project to resolve dependencies or definitions across different files (externalizing prompts, splitting in different files or directories, etc).
Despite this, the visualizer works pretty well for the kind of self-contained examples you’ll find in the official ADK documentation and the associated adk-samples GitHub repository. It’s a perfect companion for learning ADK or for quickly mapping out the structure of your single-file agent orchestrations.
Conclusion
The ADK Agent Code Visualizer is a simple yet powerful tool for anyone working with the Agent Development Kit. It streamlines the process of understanding complex agent interactions and serves as a great example of how modern AI tools like Google AI Studio, and Gemini CLI can accelerate the development lifecycle from idea to deployment.
Feel free to check it out and visualize your own agent creations! And tell me what you think!
➡️ You can try it online and check out the source code.