Building a Visualizer for Antigravity Agentic Development Sessions
When working with autonomous AI agents like Antigravity, understanding what they are doing in the background can be difficult. The agents construct reasoning chains, dispatch background tasks, and execute system commands over long sessions. All of this is recorded in detailed JSONL transcript files. Reading raw JSONL is inefficient, so I built the Antigravity Brain Visualizer to parse and render these transcripts into an interactive interface.
You can learn more about the project, view the source code, and download the visualizer app directly from the GitHub repository.
Here is a practical breakdown of the core features and how it helps debug agent behavior.
Session Management
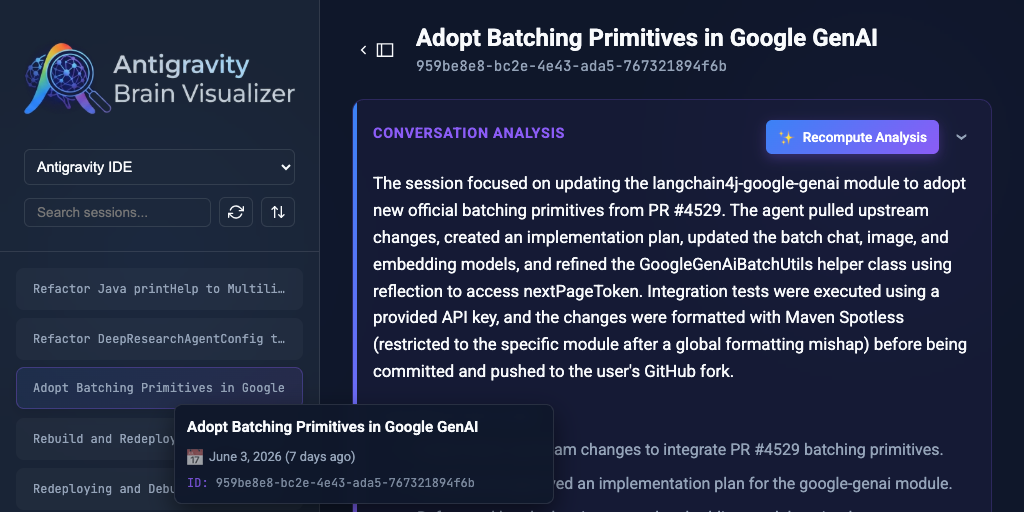
The first step was organizing the transcripts. The visualizer scans the local .gemini/brain directory and lists all past and active agent sessions in a collapsible sidebar.
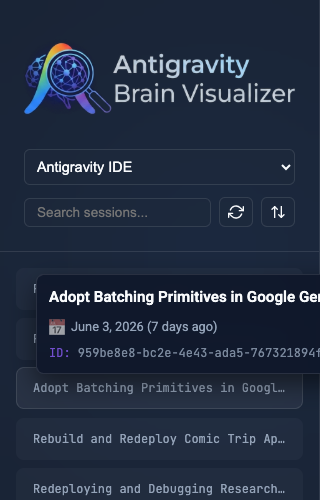
I added a search input and dropdown filters to isolate specific agent types. Hovering over any session displays a popover with metadata like the start time and session ID, so you can quickly identify the correct conversation without loading it.
The Proportional Timeline
Navigating thousands of lines of transcript requires a bird’s-eye view. I built a proportional timeline that maps active sequences and idle gaps based on real wall-clock duration.
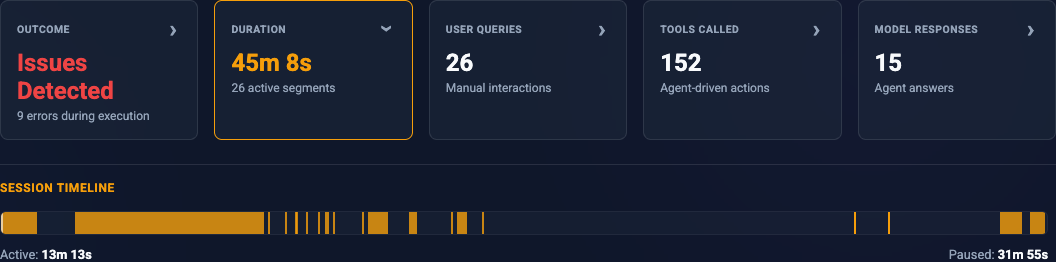
As you scroll through the transcript, a translucent viewport indicator moves across the timeline to show exactly where you are in the session. Clicking anywhere on the timeline auto-scrolls the main view to that exact chronological point. Hovering over a segment displays the start and end timestamps.
Transcript Rendering and Filtering
The core of the application is the transcript view. Raw JSONL steps are grouped into collapsible sequences triggered by user inputs.
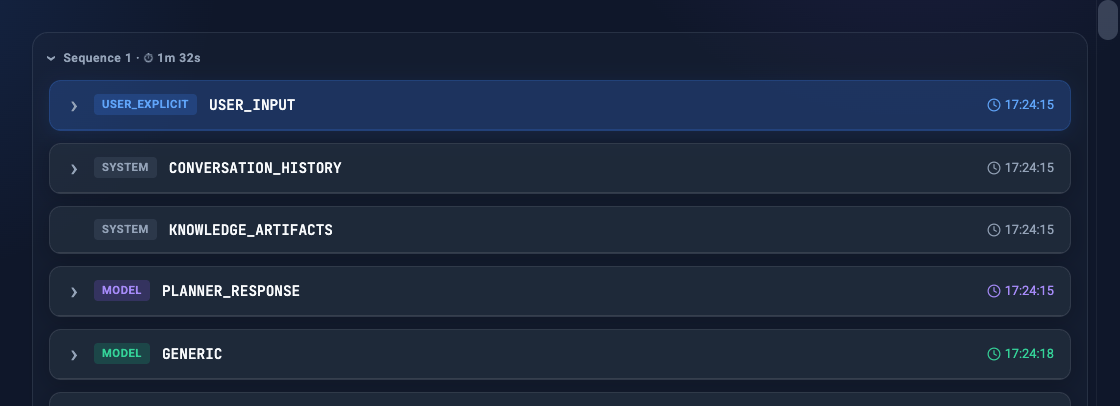
Each step is formatted as a distinct UI card depending on the actor (User, Model, Tool, System). Code blocks and tool outputs include syntax highlighting. To make debugging easier, I added step filtering toggles. If you only want to see tool calls and errors, you can hide the model’s intermediate reasoning steps entirely.
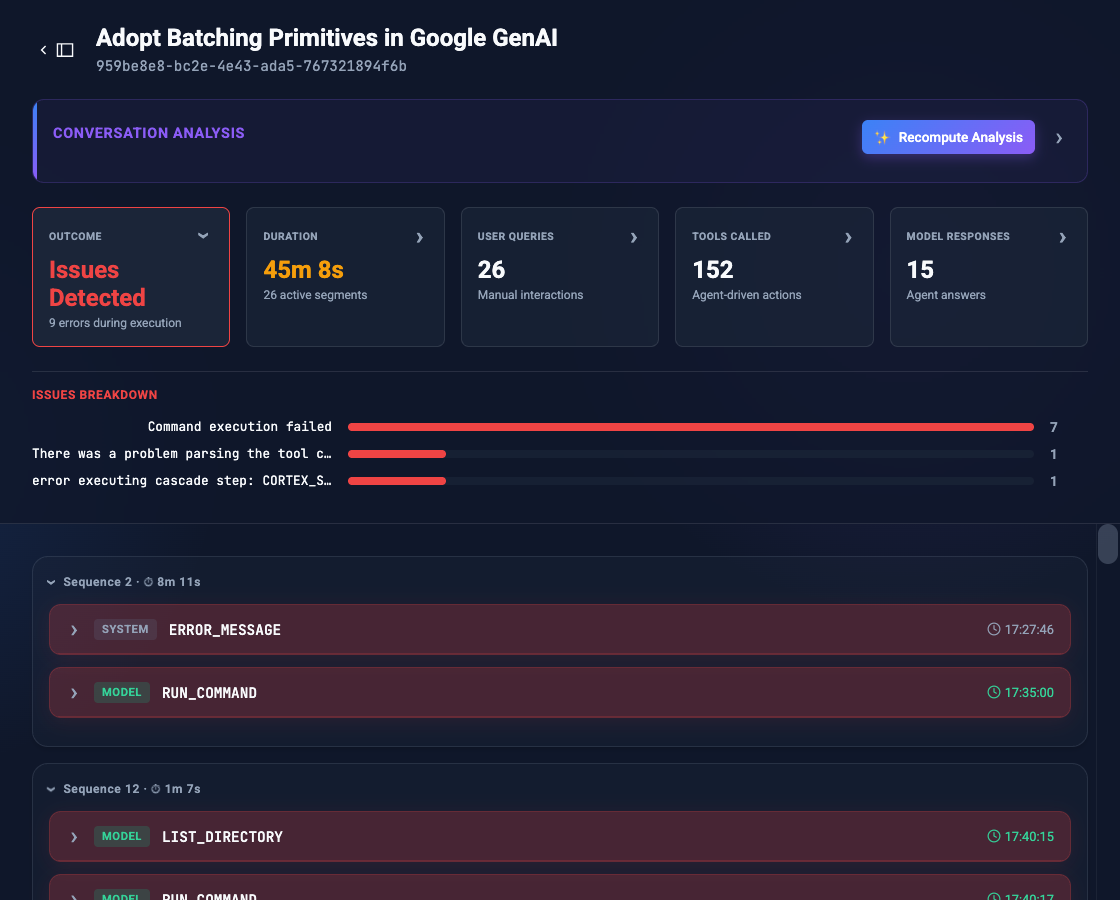
By clicking the “Issues detected” stat card at the top, the main transcript instantly filters to show only sequences containing error steps, while also displaying a breakdown chart of the specific errors encountered during the session.
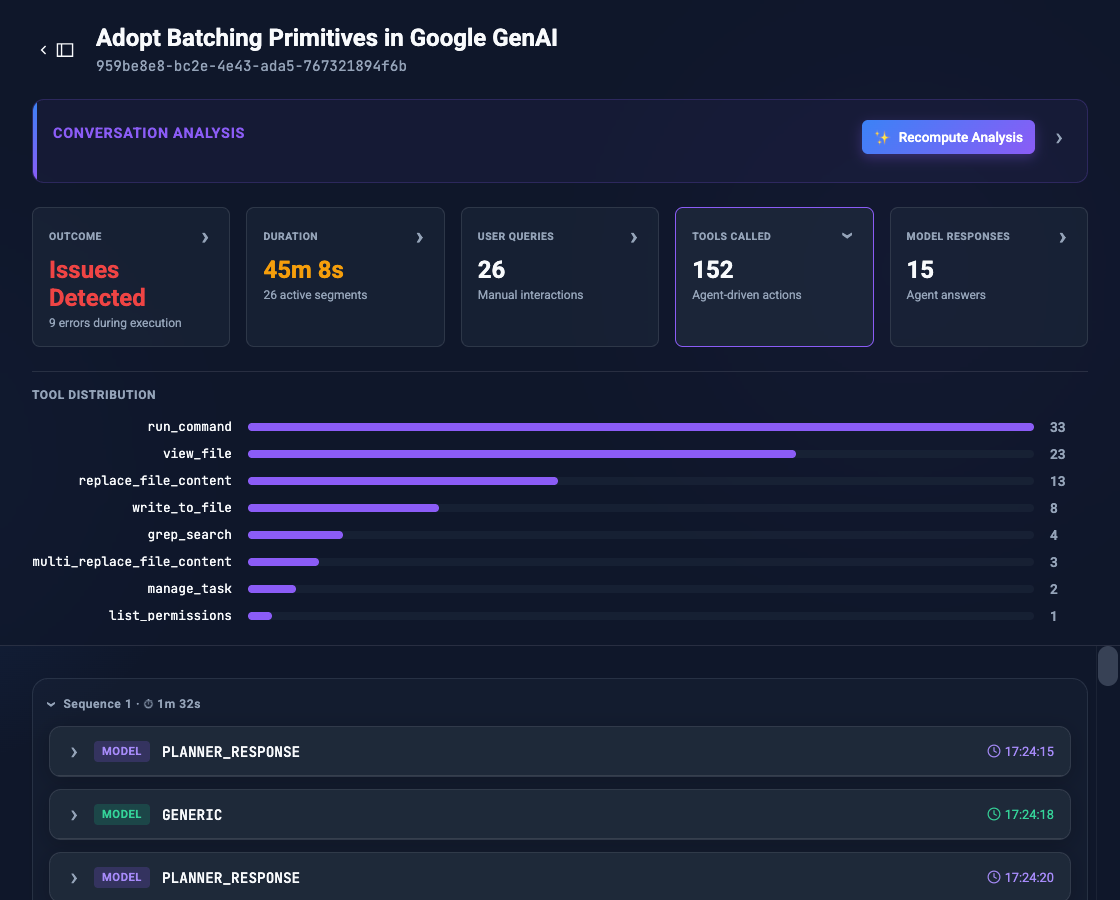
Similarly, clicking the “Tools called” card reveals a complete distribution of all agent actions taken. This allows you to immediately audit which tools or system commands the agent relied on most, while filtering the transcript down to just the raw tool execution steps.
AI Summarization
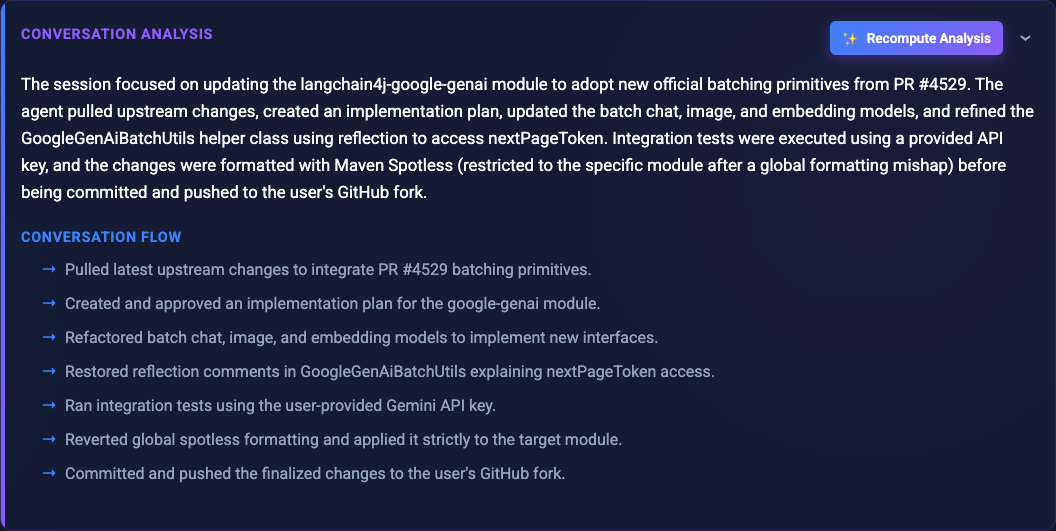
Sometimes you just need to know the outcome of a long session without reading the details. I integrated the Micronaut backend with Google’s Gemini models via LangChain4j.
When triggered, the backend parses the entire JSONL transcript, feeding the sequence of user prompts, agent reasoning, and tool executions directly to Gemini. The model studies the agent’s workflow and returns a structured post-mortem containing four key pieces of information:
Core Task: What the user was originally trying to accomplish.
Core Task Agent Actions Breakdown: A high-level chronological summary of the technical decisions and steps the agent took.
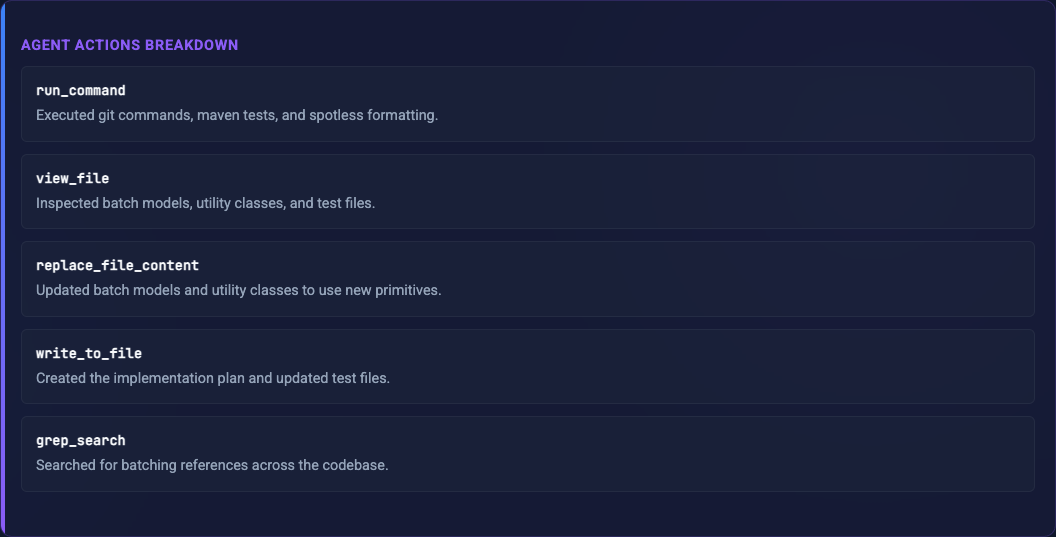
Agent Actions Breakdown Issues & Circumventions: Any roadblocks, permission errors, or broken dependencies the agent encountered, and exactly how it bypassed them.
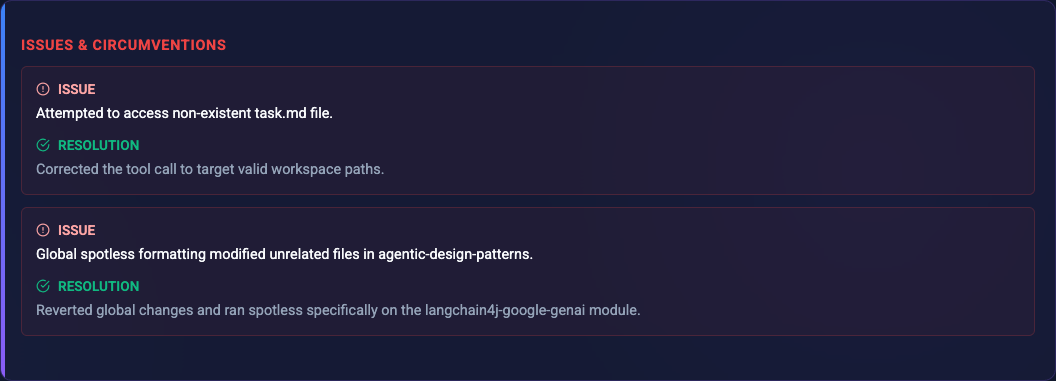
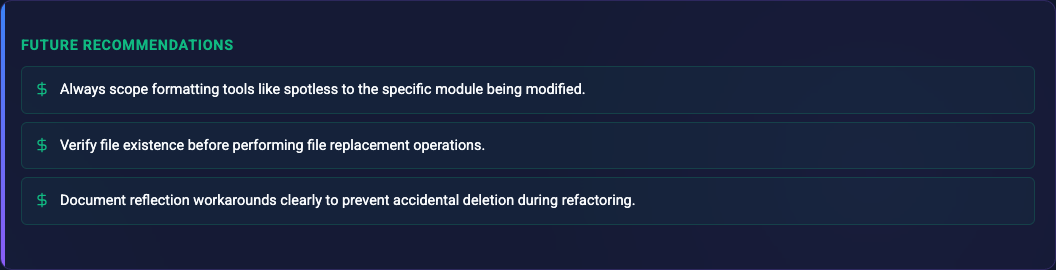
Issues and Circumventions Future Recommendations: Actionable advice on how the project or infrastructure could be improved to prevent similar friction in the future.
Future Recommendations
This structured analysis transforms raw, scattered logs into a concise, actionable report. To optimize performance, the result is cached locally in a summary.json file, preventing redundant API calls on subsequent loads.
The Secret Sauce: Tech Stack & Architecture
Building a lightweight, easy-to-distribute tool that securely handles AI logs requires a solid architecture.
The backend is powered by Micronaut, a modern JVM framework. Because ease-of-use is critical, I compiled the backend into a standalone native executable using GraalVM. This means you don’t need to mess around with Java SDKs, building from source, or configuring classpaths. You simply download the native binary for your OS, run it, and get your web interface.
For the AI summarization feature, I integrated the Google GenAI LangChain4j module. LangChain4j integrates with Micronaut via declarative @AiService interfaces.
Getting the LLM to summarize these raw JSONL files reliably was actually quite tricky. AI agents occasionally hit roadblocks and output extremely long, repetitive stack traces or tool errors. Without explicit prompt nudges and a low temperature setting, these recurring patterns would sometimes cause the model to fall into an infinite token repetition loop of its own.
Furthermore, long-running agent sessions can easily generate JSONL files that exceed Gemini’s 1-million token context window. To solve this, the backend uses a divide-and-conquer approach: it calculates token estimates, splits the transcript into safe chunks, processes them through the LLM in parallel, and then recursively consolidates those partial analysis objects back together into a final, unified summary.
Here is a look at the exact code and prompt setup I use to ensure the Gemini model consistently extracts accurate, structured data while dodging repetition traps:
@AiService
public interface AnalyzerService {
    @SystemMessage("""
        You are an expert at analyzing JSONL transcripts of Antigravity CLI sessions.
        Your job is to extract the core insights, actions, issues, and actionable recommendations
        (e.g. missing CLI tools, helpful skills to create, or AGENTS.md advice) into a structured format.
        """)
    @UserMessage("""
        Please analyze the following JSONL transcript of an Antigravity CLI session.

        CRITICAL INSTRUCTIONS:
        - NEVER fall into an infinite repetition loop. Do NOT repeat the exact same phrase or word over and over.
        - Be succinct and concise in your lists. Keep the overall size of the output compact.
        - Keep description texts short. Each issue or action description MUST be 1 or 2 sentences maximum.
        - Your summary MUST BE SHORT. No more than 3 paragraphs. Do NOT embed raw logs, code, or large quotes in the summary.

        Transcript:
        {{transcript}}
        """)
    AnalysisResponse analyze(@V("transcript") String transcript);

    // ... [recursive chunk consolidation methods omitted for brevity] ...
}
This declarative approach maps the LLM’s response directly to a strongly-typed AnalysisResponse record in Java, decoupling the AI parsing from the REST API endpoints while ensuring type-safety.
By adding @Description annotations directly to the Java record fields, LangChain4j automatically generates the JSON schemas required to guarantee the Gemini model returns properly formatted data:
@Serdeable
public record AnalysisResponse(
    @Description("A very short title (max 50 chars) summarizing the session")
    String shortTitle,

    @Description("List of short strings representing the flow. MAX 1 SENTENCE PER ITEM. DO NOT REPEAT WORDS.")
    List<String> flow,

    @Description("List of agent actions taken during the session")
    List<AgentAction> agentActions,

    @Description("List of issues or errors encountered and how they were circumvented")
    List<Issue> issues,

    @Description("List of potential improvements (e.g., missing CLI tools, skills to create, or advice for AGENTS.md) that could help future sessions go faster or circumvent errors")
    List<String> recommendations,

    @Description("A short paragraph explaining the overall outcome")
    String summary
) {}
Conclusion
The visualizer provides a structured way to inspect and debug Antigravity agents. Furthermore, the built-in AI analysis via Gemini provides insights on how to further smooth out your workflows. By delivering actionable hints—such as identifying missing system tools, suggesting new custom skills to write, or recommending tweaks to your project’s AGENTS.md file—it helps you proactively eliminate friction and prevent future errors. By moving away from tailing raw logs to an interactive timeline, it is much easier to follow the execution flow and improve agent logic.
If you haven’t yet, head over to the Antigravity website to download the agent and start building autonomous workflows. Once you’ve run a few tasks, grab the latest visualizer binaries directly from the GitHub Releases page, run the executable for your OS, and try inspecting your very own agent sessions!