
Antigravity Brain Visualizer v0.6: Single-pass Gemini 3.8 Flash analysis, artifacts, token estimation
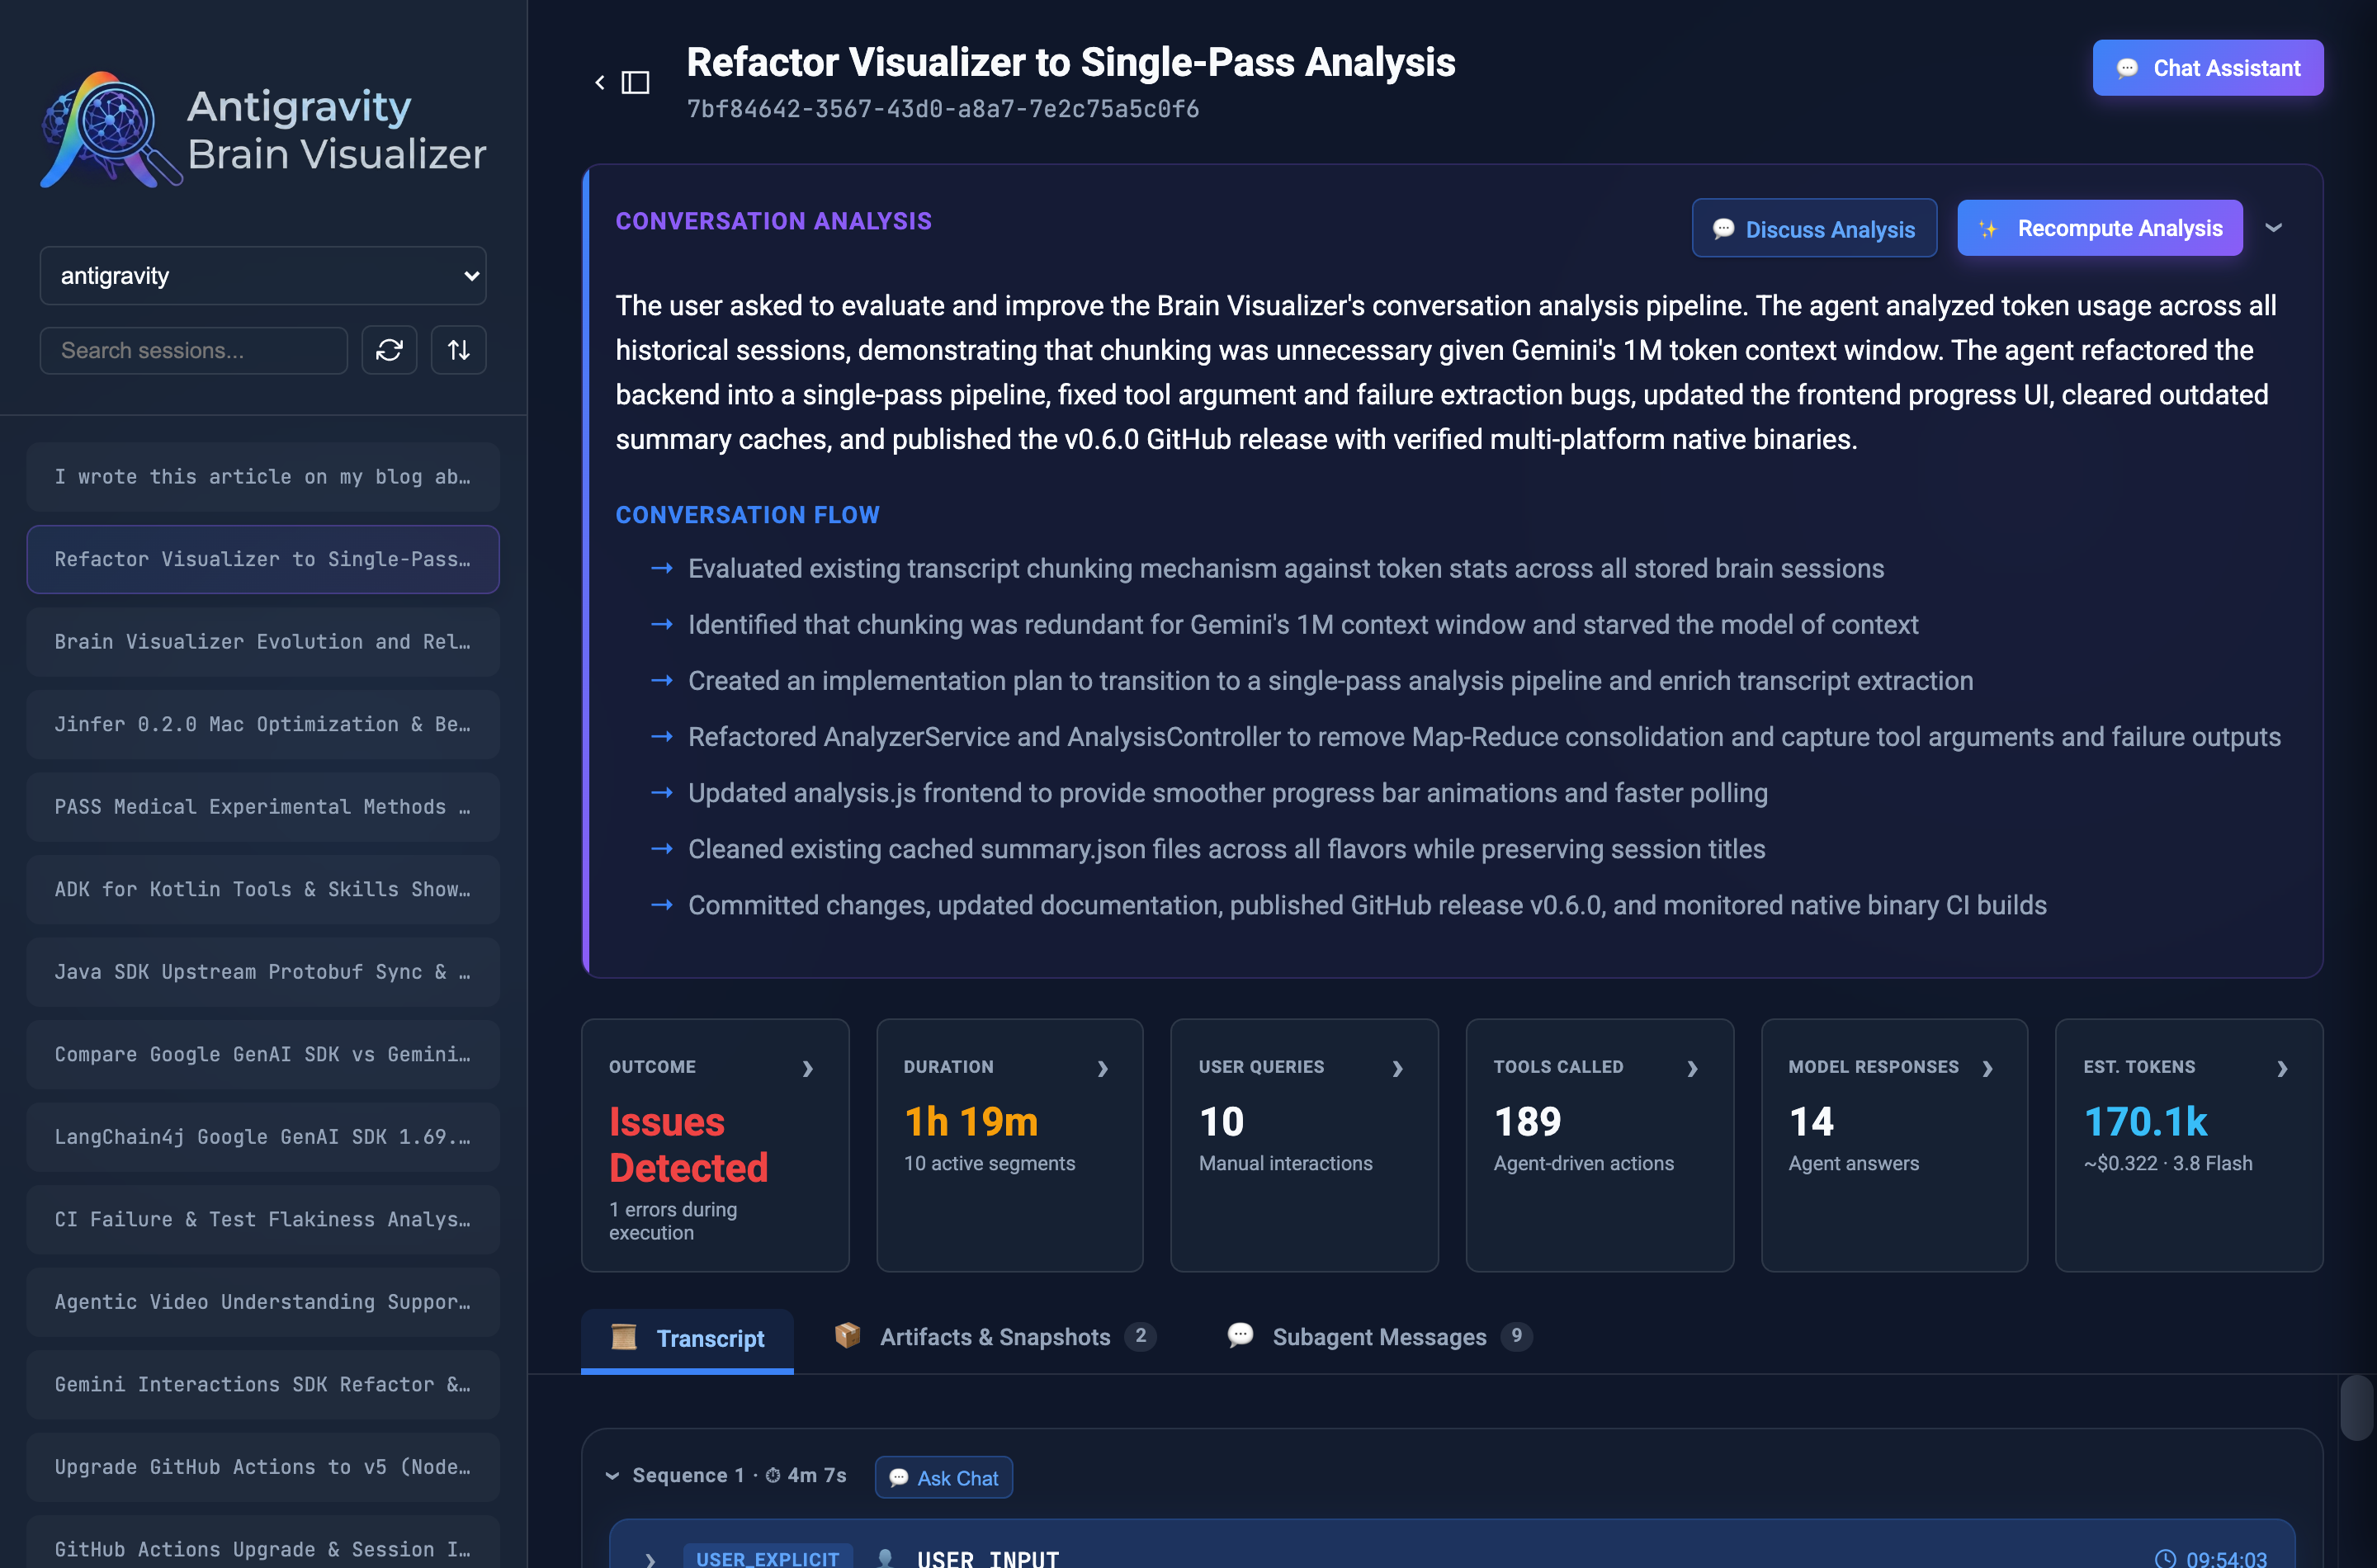
In July, I wrote about adding an interactive session assistant to the Antigravity Brain Visualizer, allowing developers to chat with Gemini directly about specific tool errors and transcript sequences from Antigravity agent runs.
Since that release, I have continued using the visualizer to inspect complex agent runs, debug failed tool invocations, and review multi-agent orchestrations. Over the last few days, I rolled out a series of incremental updates culminating in the v0.6.0 release, with pre-built binaries available on the GitHub release page.
This article walks through the main additions:
- Single-pass conversation analysis with Gemini 3.8 Flash (replacing the previous chunking and Map-Reduce pipeline)
- Dedicated Artifacts explorer for agent-generated design docs, plans, and walkthroughs
- Integrated Git snapshot history with side-by-side (
diff2html) diff viewing - Subagent messages tab with clickable navigation to child agent sessions
- Token consumption and cost estimation breakdown
You can download the pre-compiled native binaries (macOS arm64, Linux amd64, and Windows x64) directly from the v0.6.0 GitHub Release.
1. Moving from Chunking to Single-Pass Analysis
In earlier versions of the visualizer, generating an executive summary of an agent session relied on a Map-Reduce pipeline:
- The transcript was measured using LangChain4j’s
GoogleGenAiTokenCountEstimator. - Long transcripts were divided into token-bounded chunks.
- Each chunk was analyzed independently by the model.
- A consolidation pass merged the partial summaries into a final report.
While this approach guaranteed that we stayed within conservative context limits, it had three practical drawbacks:
- Latency: Multiple sequential roundtrips took 15 to 30 seconds per session.
- Context fragmentation: Slicing across arbitrary step boundaries could separate a tool call from the error it produced three steps later, leading to fragmented summaries.
Evaluating Real Session Sizes
Before deciding to keep or discard the chunking logic, I measured token sizes across all recorded sessions stored in my local .gemini/antigravity/brain directory.
Even a demanding, 80-minute multi-turn session involving 189 tool calls and deep codebase refactoring generated around 170k tokens of total transcript text (input queries, tool arguments, reasoning traces, and execution output).
With Gemini 3.8 Flash offering a native 1,000,000-token context window, chunking a 170k-token transcript is unnecessary overhead. The entire session fits into a single prompt with plenty of headroom.
The Single-Pass Pipeline
In v0.6.0, I replaced the chunking and consolidation classes with a direct, single-pass pipeline:
- The backend parses the session’s
transcript.jsonlfile and enriches each step:- Tool arguments (stored under
"args"or"arguments") are cleaned up to extract explicit actions (toolAction,Description,Instruction) and targets (TargetFile,CommandLine,Query). - Terminal execution results are scanned for failure patterns (
The command failed with exit code, non-zero return codes) so actual errors and stack traces are captured rather than swallowed. - Final agent conclusions and verification outputs (
BUILD SUCCESSFUL, passed test counts) are preserved.
- Tool arguments (stored under
- The enriched transcript is passed to
gemini-3.8-flashin a single prompt using structured JSON schema output via Jackson annotations (AnalysisResponse).
The results are immediate:
- Execution time: Analysis now completes in 3 to 5 seconds instead of 20+ seconds.
- Coherence: Because Gemini sees the entire chronology at once, it connects root causes to their eventual fixes without dropping intermediate context.
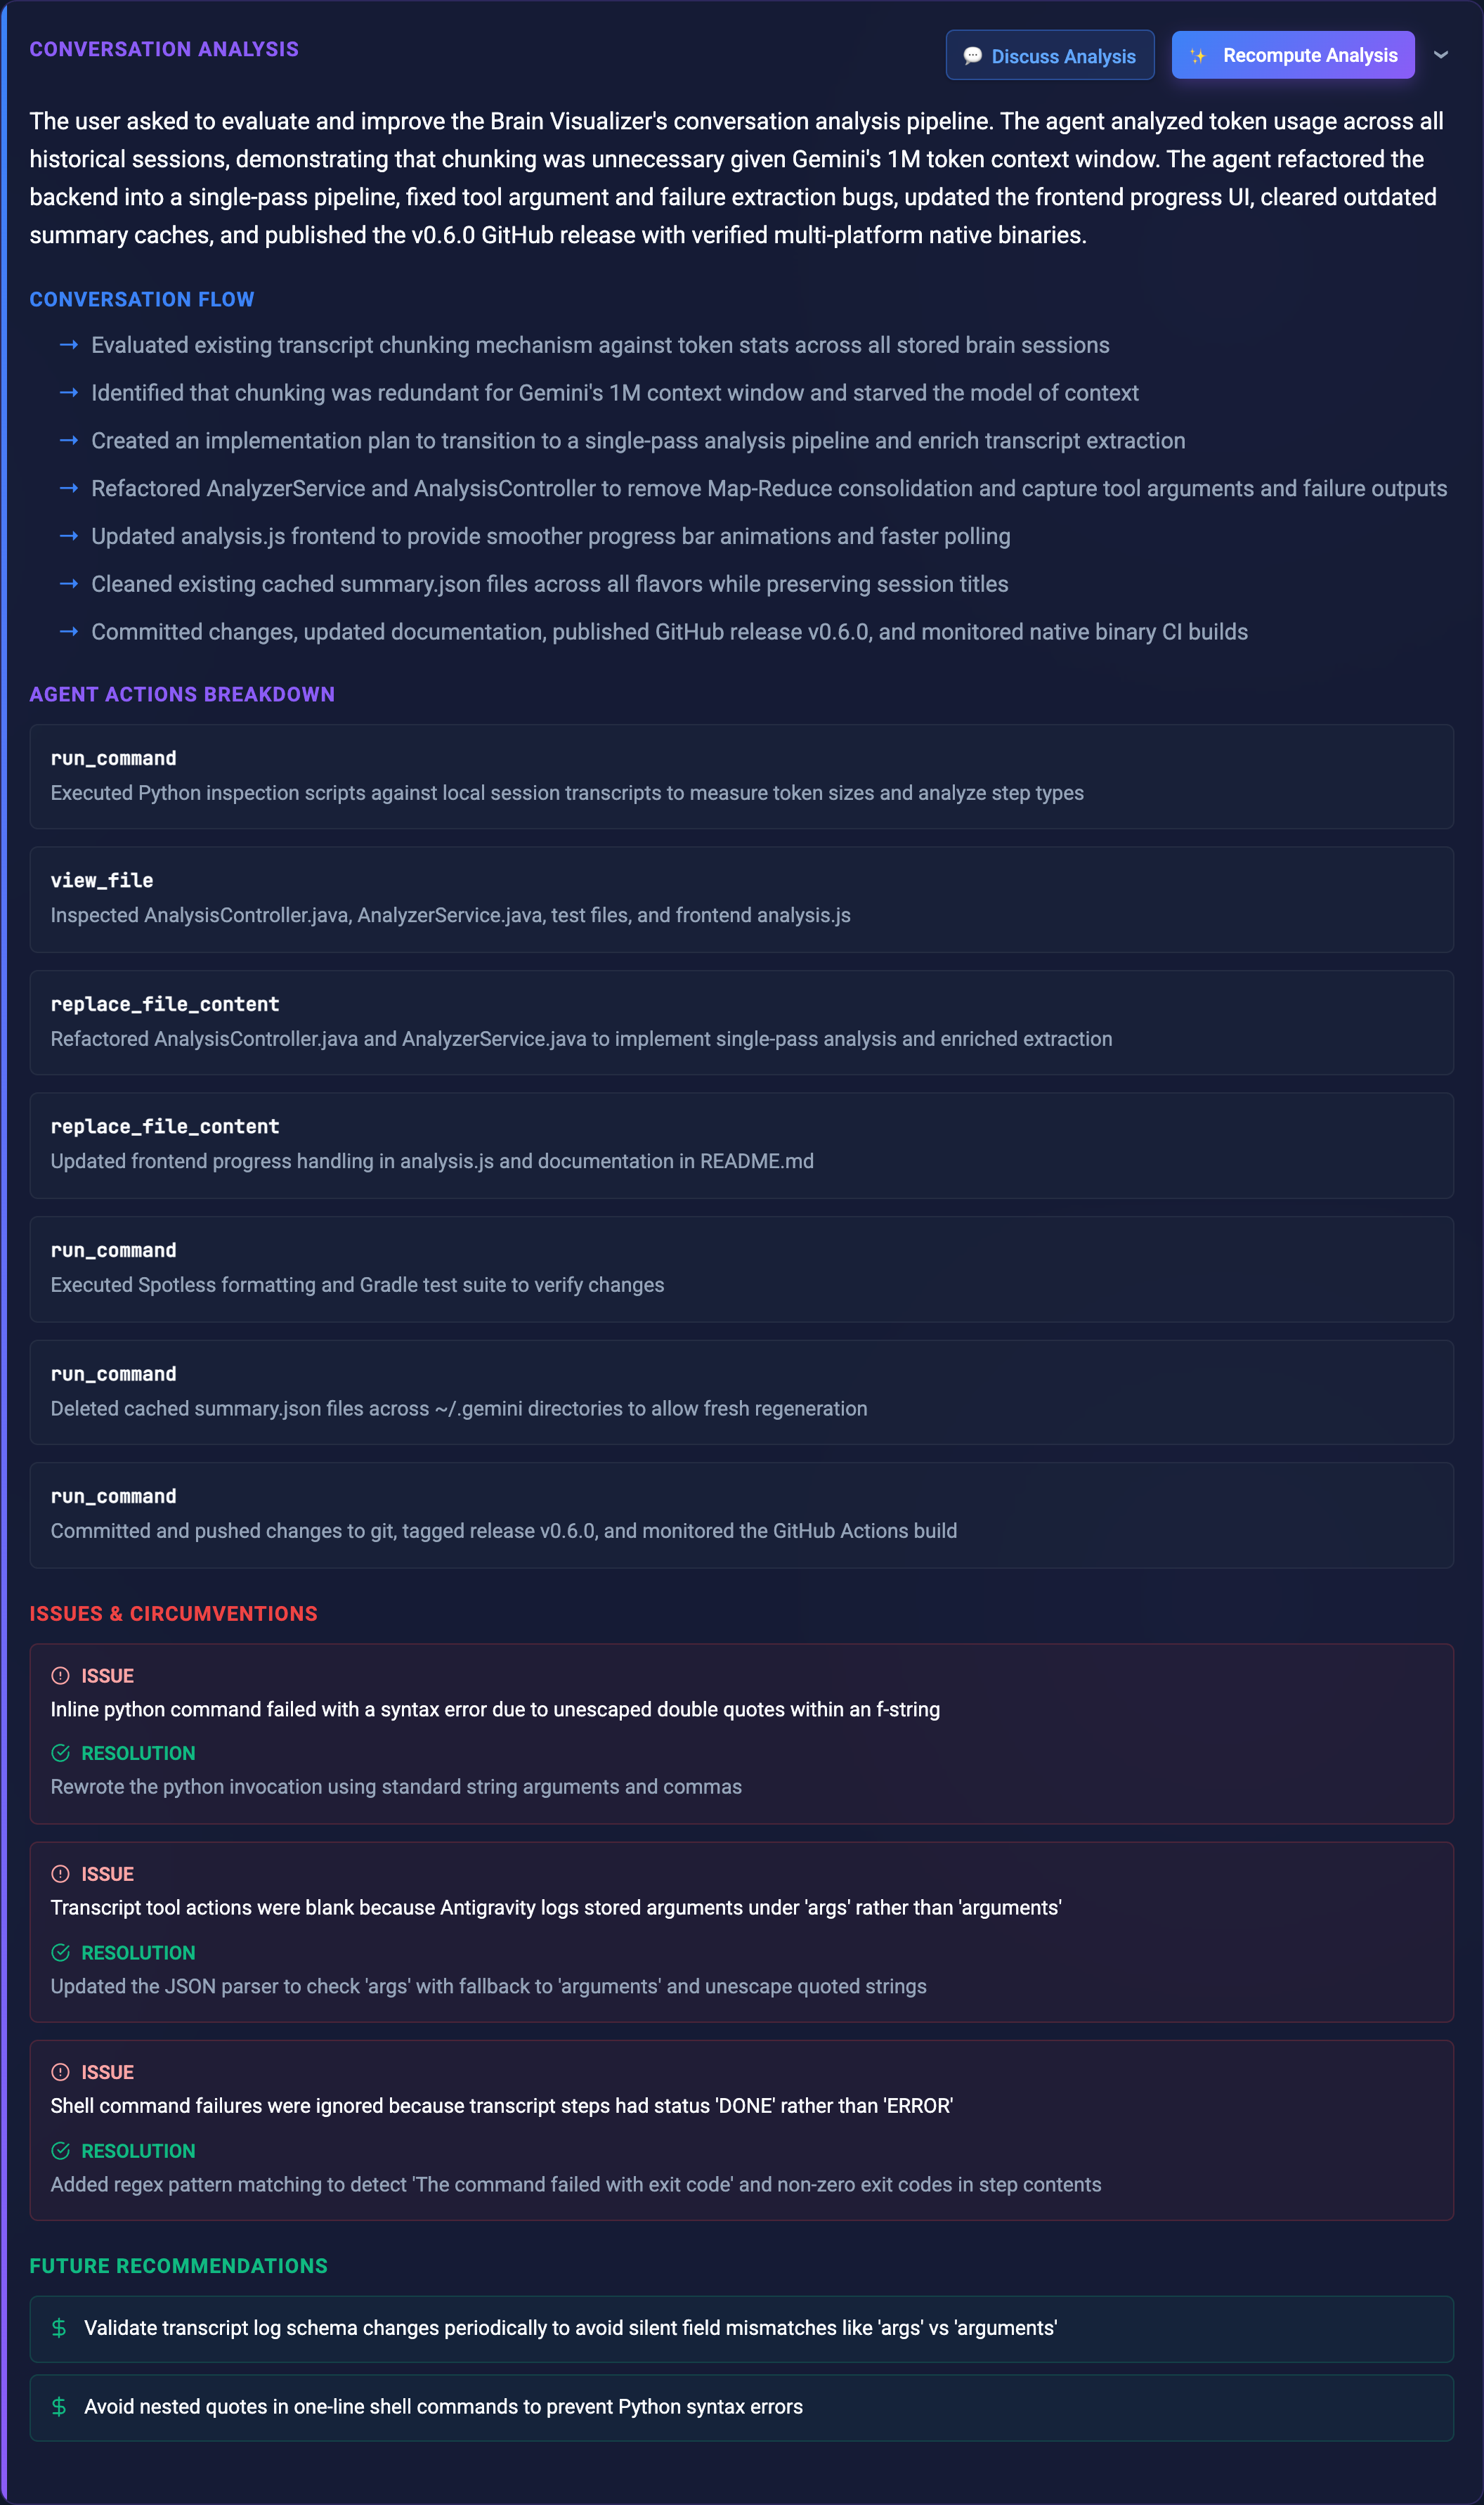
As shown in the screenshot above, the generated analysis card now provides:
- Executive Summary: A concise summary of the overall goal and result.
- Conversation Flow: A chronological sequence of what happened, step by step.
- Agent Actions Breakdown: Grouped list of tools called (
run_command,view_file,replace_file_content) with exact target files and commands. - Issues & Circumventions: Every obstacle the agent ran into (such as syntax errors or path mismatches) alongside the exact resolution it applied.
- Future Recommendations: Actionable suggestions to prevent similar failures in future prompts or skills.
2. Token Consumption & Cost Estimation
To better understand where LLM resources go during agent runs, I added a token estimation module to the session statistics header.
Token Breakdown
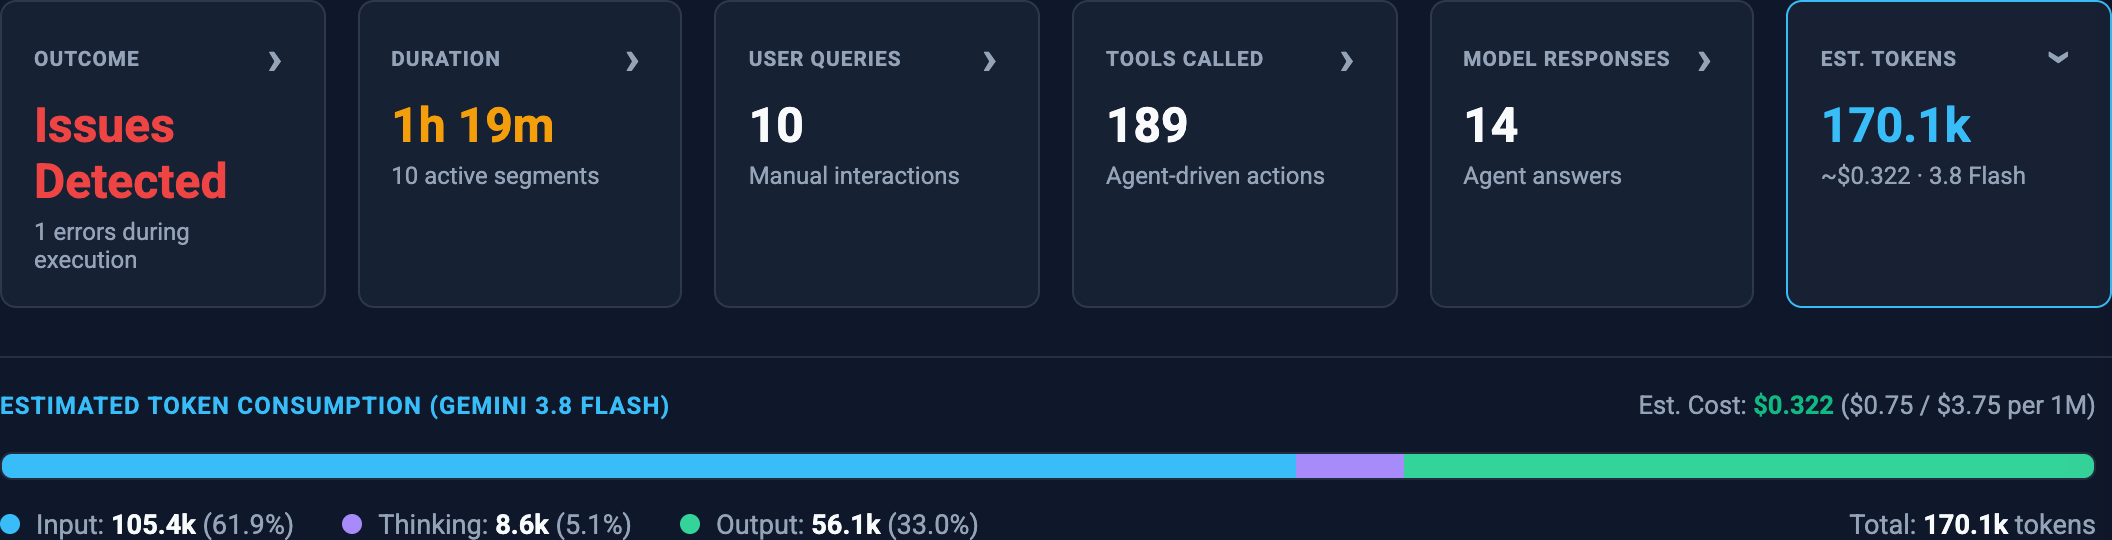
Clicking the EST. TOKENS card in the stats grid expands a proportional horizontal breakdown bar:
- Input Tokens (cyan): User queries, system instructions, and tool execution outputs returned from the environment.
- Thinking Tokens (purple): Internal reasoning chains (
thinkingblocks) produced by reasoning-capable models prior to selecting tool calls. - Output Tokens (green): Model responses, formatted chat answers, and serialized tool call parameters.
Pricing Calculations
Financial cost projections are calculated in real time using the official Gemini 3.8 Flash pricing tiers:
- $0.75 per 1,000,000 input tokens
- $3.75 per 1,000,000 output tokens (including thinking tokens)
In the session shown above (which executed 189 tool calls over 1 hour and 19 minutes), the total consumption of 170.1k tokens (105.4k input, 8.6k thinking, 56.1k output) came out to an estimated $0.322. Having this metric right on the session dashboard makes it easy to monitor agent costs across different types of tasks.
3. Dedicated Artifacts Explorer
Antigravity agents frequently produce standalone documents during complex workflows: implementation plans (implementation_plan.md), post-execution walkthroughs (walkthrough.md), architecture designs, or technical RFCs.
Previously, these files remained buried in the session directory unless opened manually in an editor.
I introduced the 📦 Artifacts & Snapshots tab to make these deliverables first-class citizens.
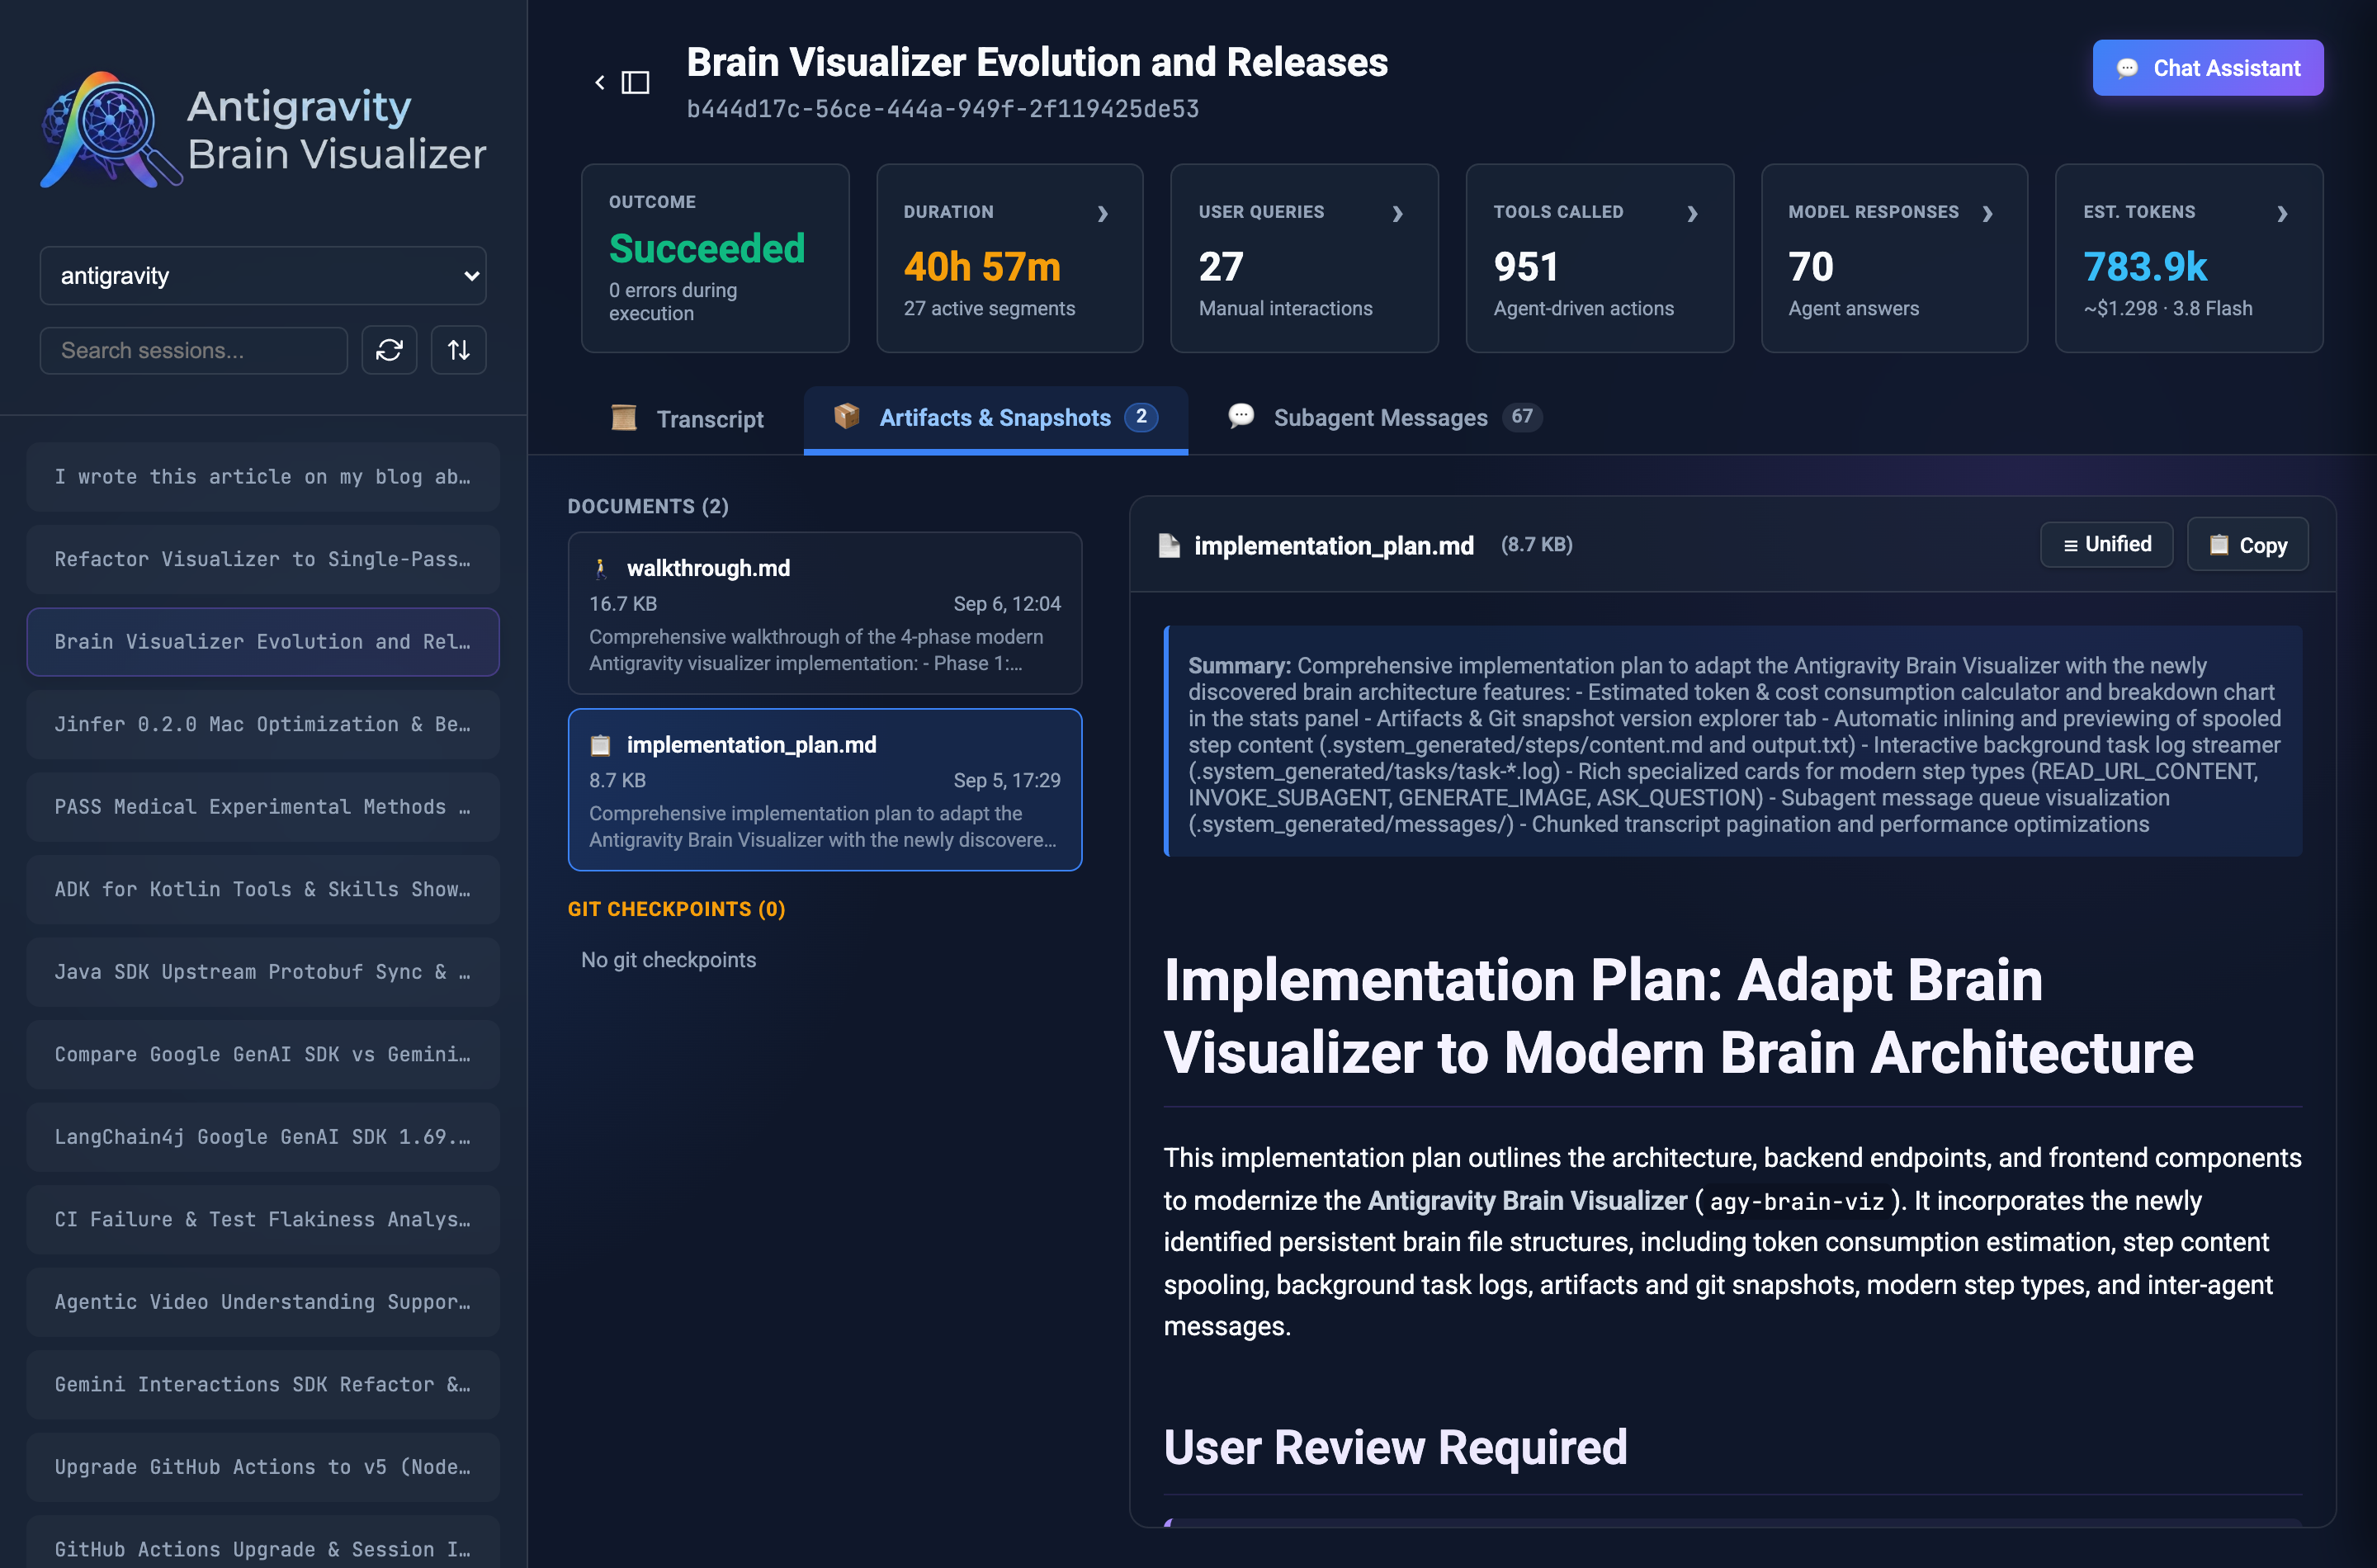
When an agent writes an artifact, it also records a corresponding .metadata.json file. The Artifacts explorer:
- Lists all Markdown files found in the active session directory with their file sizes and timestamps.
- Extracts metadata properties (such as
userFacing,requestFeedback, andsummary) and renders them in a blue callout card at the top of the preview. - Renders the Markdown content with typography styling, headings, tables, and syntax-highlighted code fences.
- Includes a
📋 Copybutton to copy the raw Markdown directly to the clipboard.
In the example above, inspecting the visualizer’s own modernization session reveals its implementation_plan.md alongside the summary metadata card and user review requirements.
4. Git Checkpoints & Side-by-Side Diffs
During longer tasks, Antigravity records Git snapshots in a local repository under the session folder. These checkpoints capture the filesystem state at key moments during execution.
Under the same Artifacts & Snapshots tab, the visualizer detects any .git repository present in the session directory and displays its commit history in chronological order.
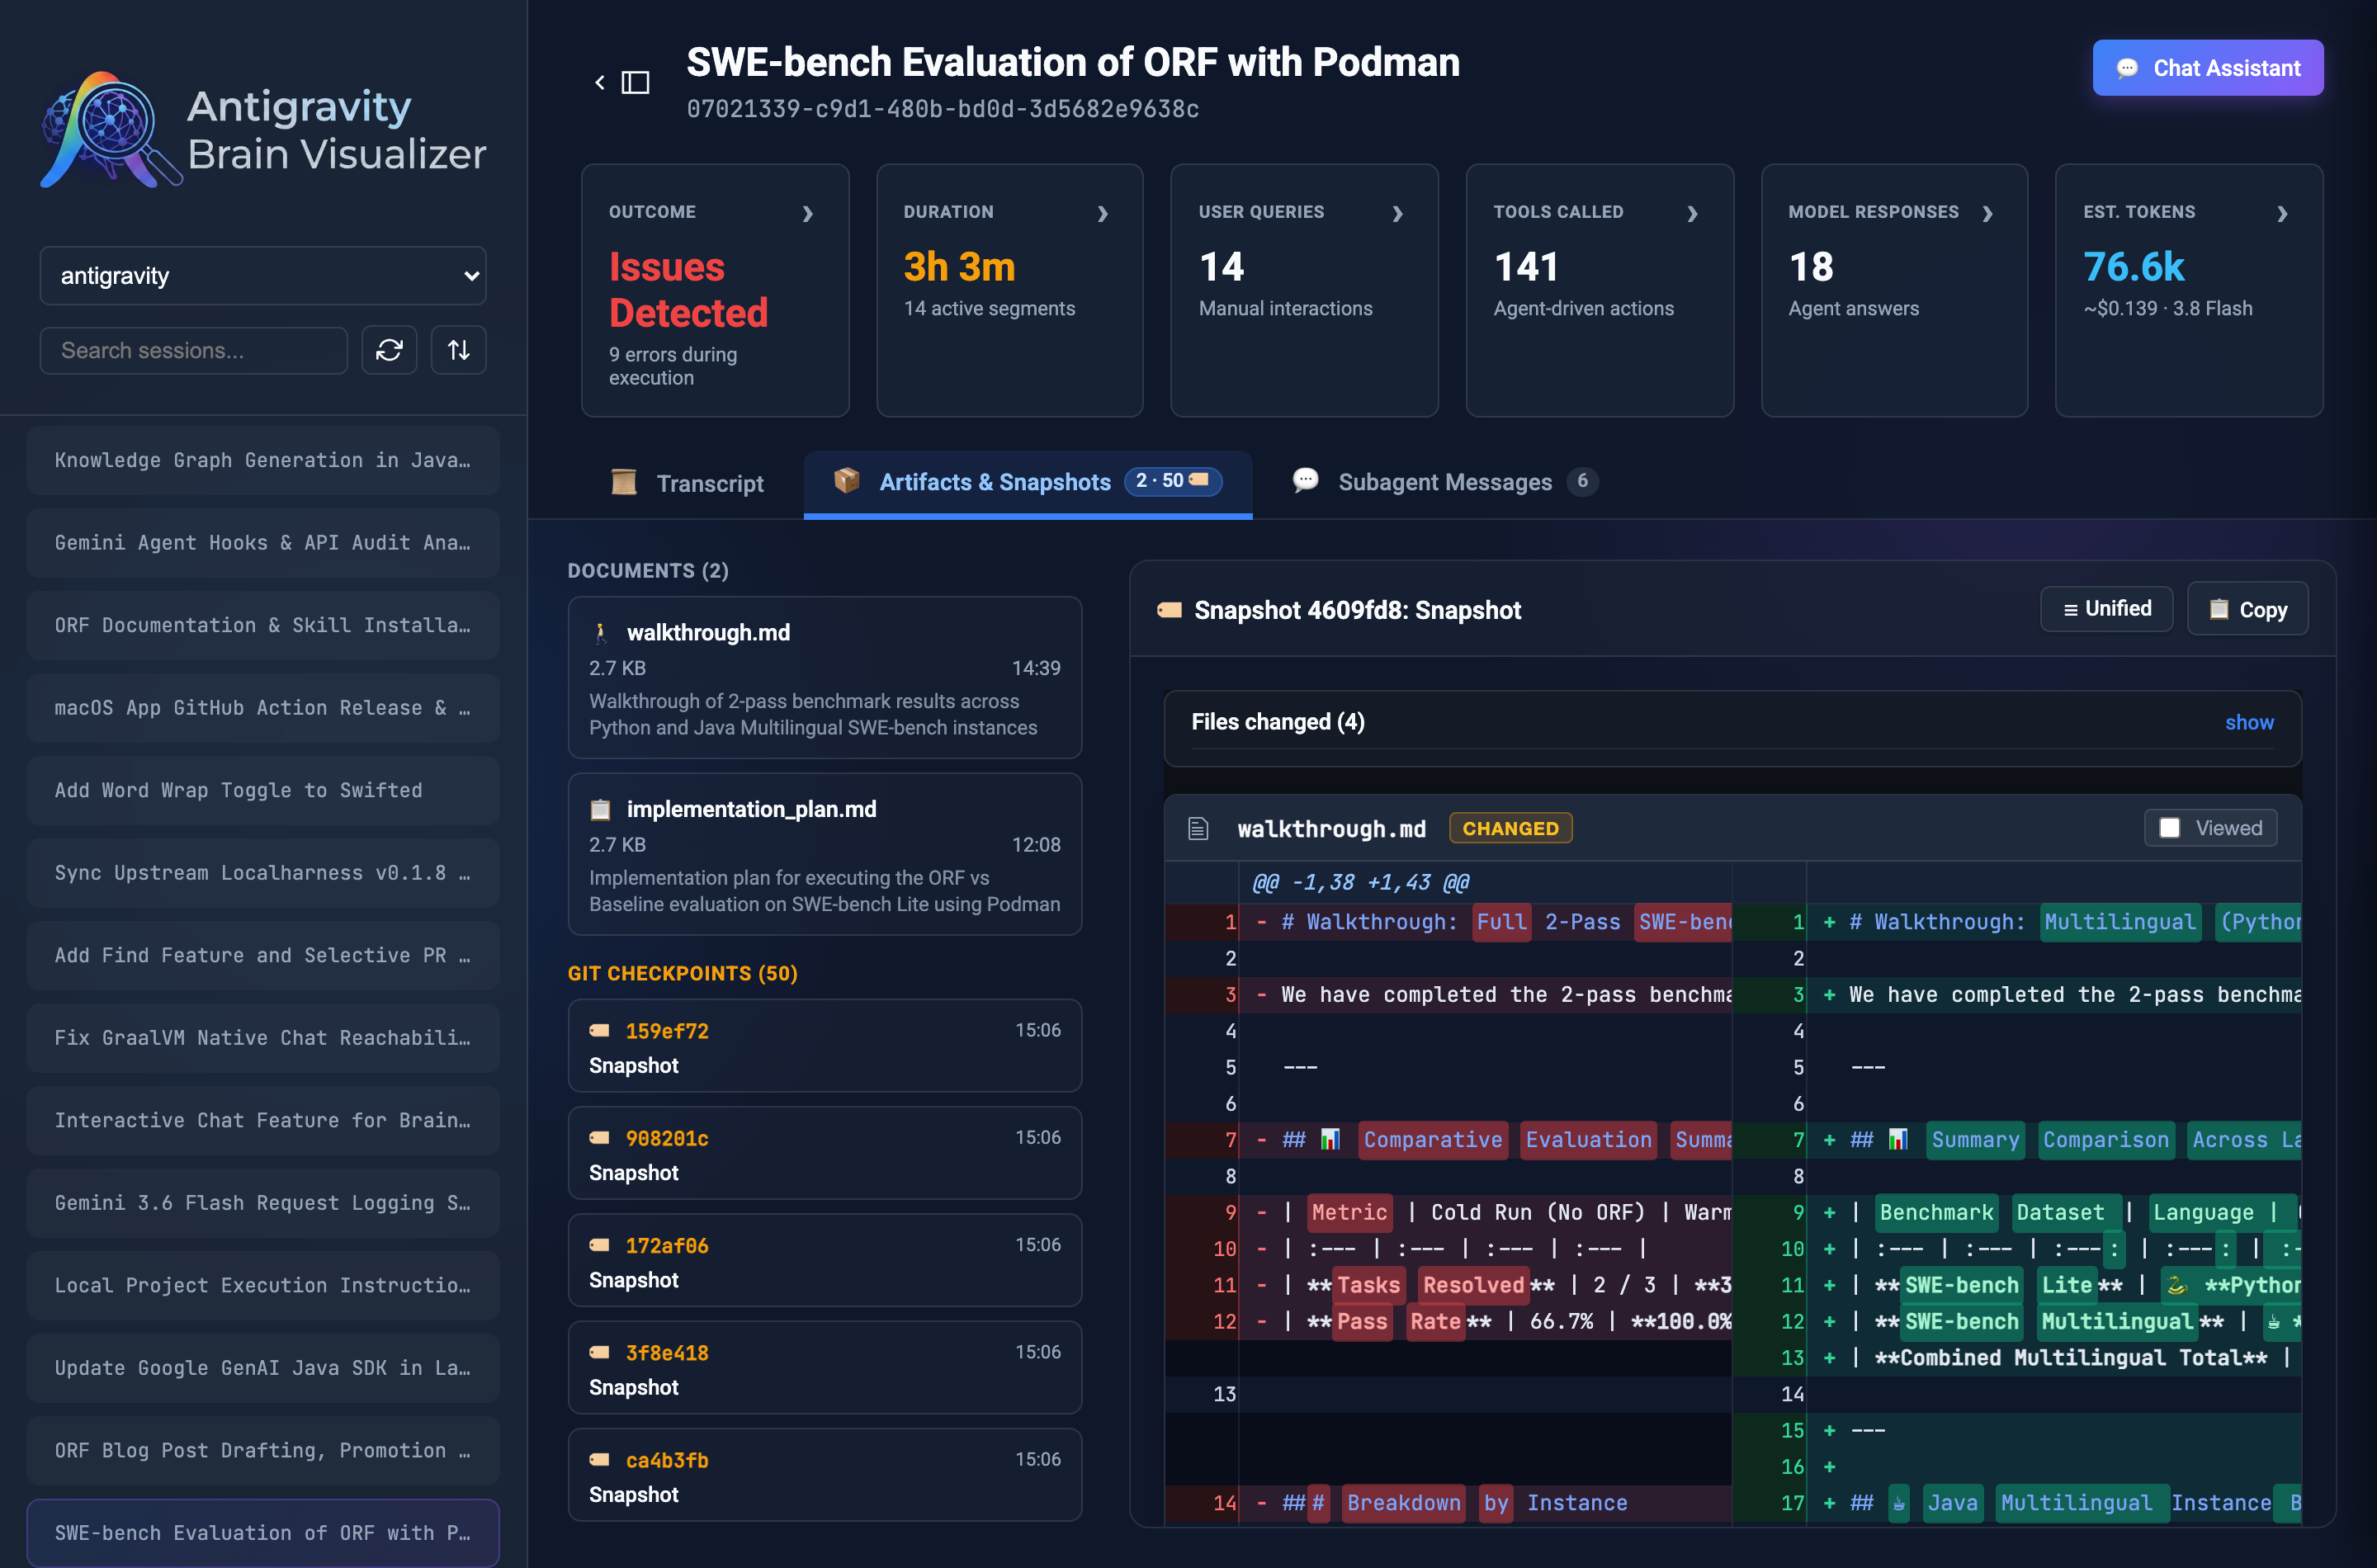
Selecting any snapshot in the Git Checkpoints list renders the changes using an integrated instance of diff2html:
- Split vs. Unified View: Toggle between side-by-side split view and line-by-line unified view using the
[☰ Unified / ⊞ Split]button. - File Level Collapsing: Expand or collapse individual modified files.
- Precise Additions & Deletions: Color-coded line additions (green) and deletions (red).
This allows inspecting code modifications as Git commits directly within the tool, without needing to switch to a terminal or external Git GUI.
5. Multi-Agent Delegation: Subagent Messages
When using Antigravity features like /boost or multi-agent orchestration, a parent orchestrator delegates subtasks to specialized worker agents (e.g., DeepCoder, DeepInvestigator).
These agents communicate with each other using inter-agent messaging tools (send_message).
To make multi-agent interactions transparent, I added the 💬 Subagent Messages tab:
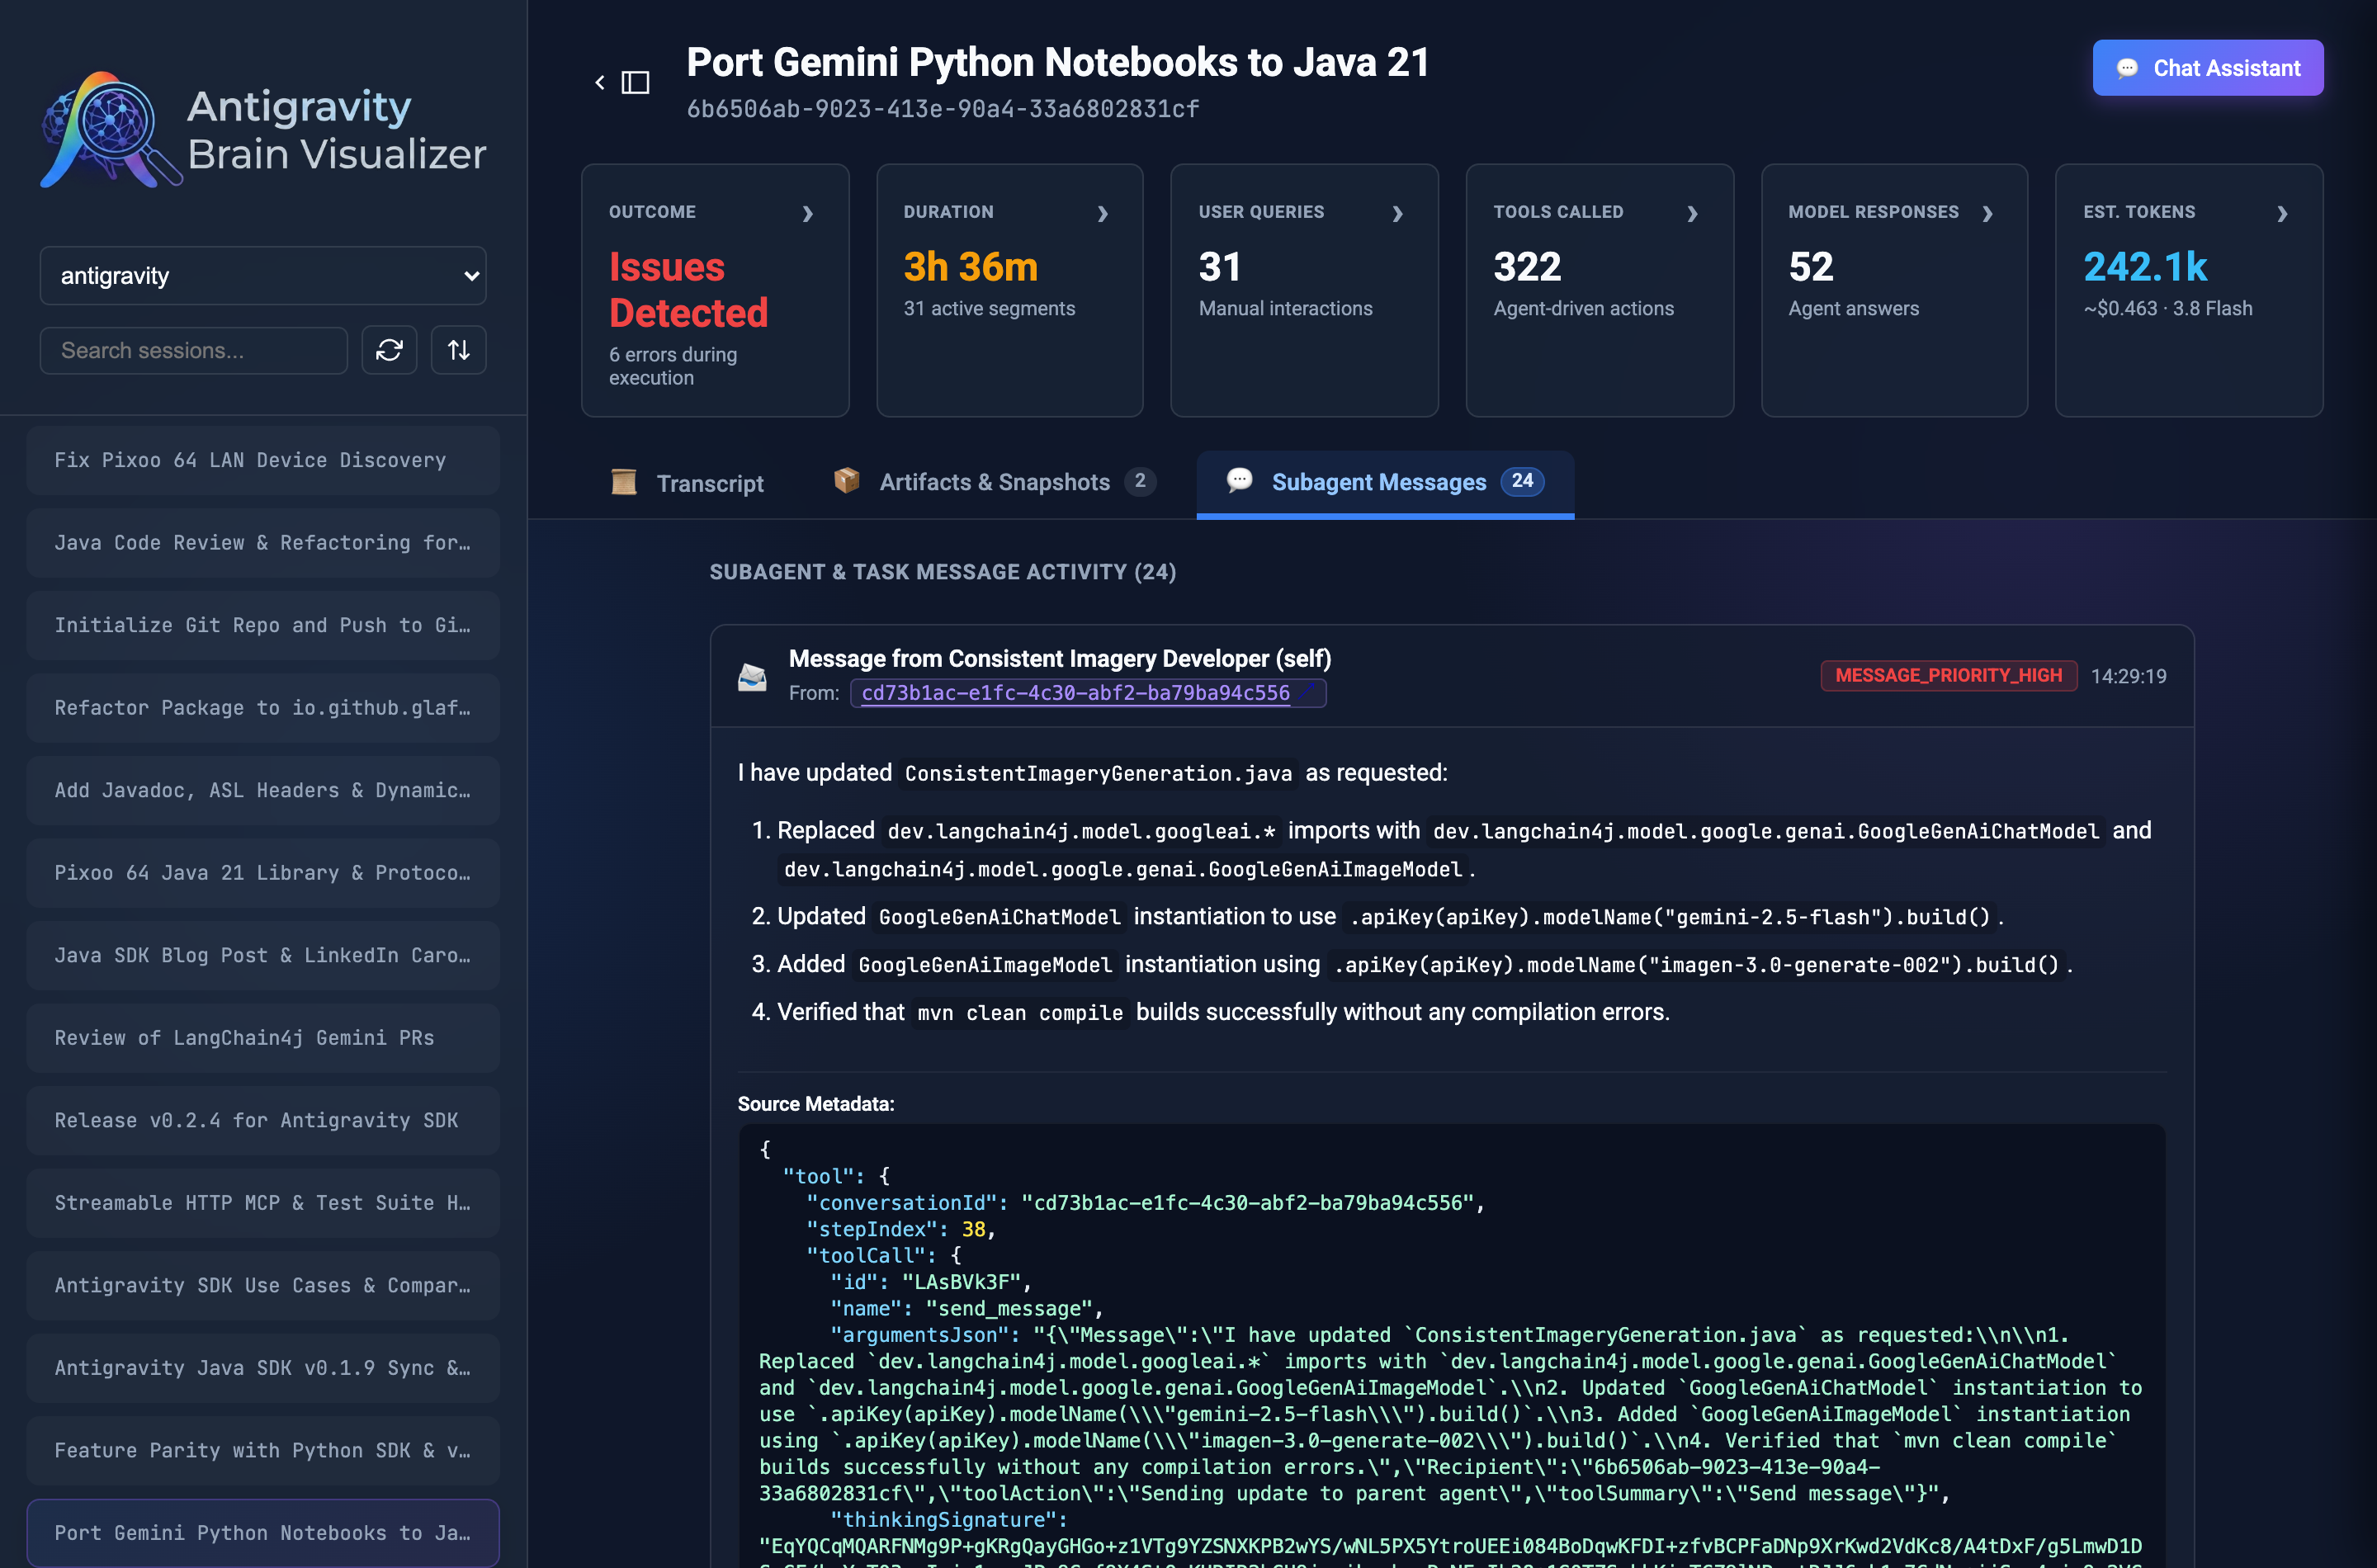
Clickable Subagent Navigation
The sender badge (From: [UUID ↗]) is an active navigation link.
Clicking the sender badge switches the visualizer to that subagent’s conversation transcript, so you can inspect the exact tool calls, terminal outputs, and reasoning steps executed by the worker agent, then jump back to the orchestrator session when done.
Markdown Alerts & Formatting
Subagent messages often contain technical status reports with alerts and code blocks. I centralized the Markdown rendering pipeline across the application:
- Formatted Markdown & Status Reports: Text renders with typography, lists, bold accents, and inline code formatting (
mvn clean compile, Java class names). - GitHub-style Alerts: Syntax like
> [!WARNING]or> [!NOTE]is transformed into formatted callout cards with distinct border colors and icons. - Command Output Preformatting: Raw terminal command results (
Output:\n...) are automatically formatted inside monospace code blocks with preserved newlines rather than collapsing into a single paragraph. - XML Tag Unwrapping: System tags commonly injected into prompts (like
<original_task>,<task>,<context>) are unwrapped so headings and lists format properly. - Collapsible Source Metadata: Expanding the metadata section reveals the raw JSON payload and the
send_messagetool parameters.
Getting Started with v0.6.0
You do not need to install a Java Development Kit (JDK) or Gradle to run the visualizer. Pre-compiled GraalVM native binaries are built for every release via GitHub Actions.
Download
Download the archive corresponding to your platform from the GitHub Releases page:
- macOS (Apple Silicon):
agy-brain-viz-macos-arm64.zip - Linux (x64):
agy-brain-viz-linux-amd64.zip - Windows (x64):
agy-brain-viz-windows-amd64.exe.zip
Running the Visualizer
Extract the archive and provide your Gemini API key:
# macOS / Linux
unzip agy-brain-viz-macos-arm64.zip
chmod +x agy-brain-viz
export GEMINI_API_KEY="your-gemini-api-key"
./agy-brain-viz
Open your browser at http://localhost:8080.
You can also customize the port or specify a custom model if needed:
./agy-brain-viz --micronaut.server.port=9090 --gemini.model=gemini-3.8-flash
Summary
With v0.6.0, the Antigravity Brain Visualizer covers the full lifecycle of an Antigravity agent run:
- Inspecting the raw step chronology in the Transcript view.
- Reviewing written documents and Git commits in the Artifacts & Snapshots view.
- Tracing delegations across worker agents in the Subagent Messages view.
- Auditing token usage and costs in the Token Estimation panel.
- Getting a 3-second overview of what happened with Single-Pass Analysis powered by Gemini 3.8 Flash.
Feedback, bug reports, and contributions are welcome on the GitHub repository.